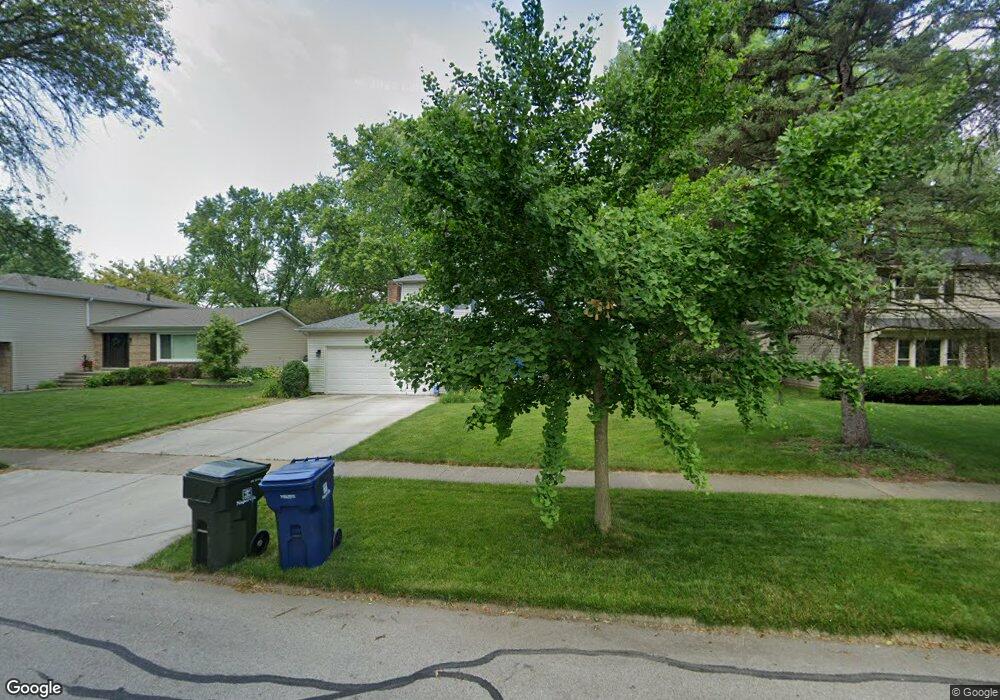
1505 Hyde Park Ln Unit 2 Naperville, IL 60565
Meadow Glens NeighborhoodEstimated Value: $545,832 - $625,000
--
Bed
1
Bath
2,308
Sq Ft
$250/Sq Ft
Est. Value
About This Home
This home is located at 1505 Hyde Park Ln Unit 2, Naperville, IL 60565 and is currently estimated at $577,958, approximately $250 per square foot. 1505 Hyde Park Ln Unit 2 is a home located in DuPage County with nearby schools including Meadow Glens Elementary School, Madison Jr High School, and Naperville Central High School.
Ownership History
Date
Name
Owned For
Owner Type
Purchase Details
Closed on
Jul 29, 2014
Sold by
Subgrunski Maribeth
Bought by
Subgrunski Maribeth and Subgrunski Trust
Current Estimated Value
Purchase Details
Closed on
Jun 29, 2000
Sold by
Devine Thomas J and Devine Cynthia A
Bought by
Subgrunski Gary C and Subgrunski Maribeth
Home Financials for this Owner
Home Financials are based on the most recent Mortgage that was taken out on this home.
Original Mortgage
$111,000
Outstanding Balance
$40,619
Interest Rate
8.55%
Estimated Equity
$537,339
Purchase Details
Closed on
Apr 25, 1997
Sold by
Thompson Paul J
Bought by
Devine Thomas J and Devine Cynthia A
Home Financials for this Owner
Home Financials are based on the most recent Mortgage that was taken out on this home.
Original Mortgage
$190,000
Interest Rate
8.5%
Mortgage Type
VA
Purchase Details
Closed on
Mar 25, 1997
Sold by
Thompson Patricia K
Bought by
Thompson Paul J
Home Financials for this Owner
Home Financials are based on the most recent Mortgage that was taken out on this home.
Original Mortgage
$190,000
Interest Rate
8.5%
Mortgage Type
VA
Create a Home Valuation Report for This Property
The Home Valuation Report is an in-depth analysis detailing your home's value as well as a comparison with similar homes in the area
Home Values in the Area
Average Home Value in this Area
Purchase History
| Date | Buyer | Sale Price | Title Company |
|---|---|---|---|
| Subgrunski Maribeth | -- | None Available | |
| Subgrunski Gary C | $231,000 | -- | |
| Devine Thomas J | $190,000 | -- | |
| Thompson Paul J | -- | -- |
Source: Public Records
Mortgage History
| Date | Status | Borrower | Loan Amount |
|---|---|---|---|
| Open | Subgrunski Gary C | $111,000 | |
| Previous Owner | Devine Thomas J | $190,000 |
Source: Public Records
Tax History Compared to Growth
Tax History
| Year | Tax Paid | Tax Assessment Tax Assessment Total Assessment is a certain percentage of the fair market value that is determined by local assessors to be the total taxable value of land and additions on the property. | Land | Improvement |
|---|---|---|---|---|
| 2024 | $8,997 | $154,855 | $69,018 | $85,837 |
| 2023 | $8,664 | $141,330 | $62,990 | $78,340 |
| 2022 | $8,291 | $134,100 | $59,770 | $74,330 |
| 2021 | $7,986 | $129,030 | $57,510 | $71,520 |
| 2020 | $7,815 | $126,710 | $56,480 | $70,230 |
| 2019 | $7,585 | $121,230 | $54,040 | $67,190 |
| 2018 | $7,587 | $121,230 | $54,040 | $67,190 |
| 2017 | $7,432 | $117,140 | $52,220 | $64,920 |
| 2016 | $7,281 | $112,900 | $50,330 | $62,570 |
| 2015 | $7,232 | $106,320 | $47,400 | $58,920 |
| 2014 | $6,916 | $98,920 | $47,690 | $51,230 |
| 2013 | $6,812 | $99,150 | $47,800 | $51,350 |
Source: Public Records
Map
Nearby Homes
- 1449 Whitespire Ct Unit 5104
- 456 Timber Trail Ct
- 8S452 Bell Dr
- 431 Orleans Ave
- 621 Bourbon Ct
- 1323 Auburn Ave
- 1717 Drake Ct
- 158 E Bailey Rd Unit F
- 144 E Bailey Rd Unit L
- 1340 Auburn Ave
- 128 E Bailey Rd Unit G
- 138 E Bailey Rd Unit M
- 1408 Swallow St
- 1519 77th St
- 1721 S Washington St Unit 1721
- 517 Sheffield Rd
- 1751 S Washington St Unit 1
- 1216 Tranquility Ct
- 1704 Kenyon Dr
- 1643 Estate Cir
- 1501 Hyde Park Ln
- 1509 Hyde Park Ln
- 620 Sara Ln
- 1511 Hyde Park Ln
- 619 Harlowe Ct
- 1504 Hyde Park Ln
- 620 Harlowe Ct
- 616 Sara Ln
- 1508 Hyde Park Ln
- 1502 Hyde Park Ln Unit 2
- 1515 Hyde Park Ln
- 1512 Hyde Park Ln
- 625 Sara Ln Unit 2
- 629 Sara Ln
- 615 Harlowe Ct
- 612 Sara Ln Unit 2
- 621 Sara Ln Unit 2
- 618 Harlowe Ct
- 1516 Hyde Park Ln
- 1519 Hyde Park Ln