J
Seller's Agent in 2024
Jordan Lee
1 Percent Lists Evolution
(641) 745-0216
2 in this area
64 Total Sales


Estimated Value: $453,000 - $485,309
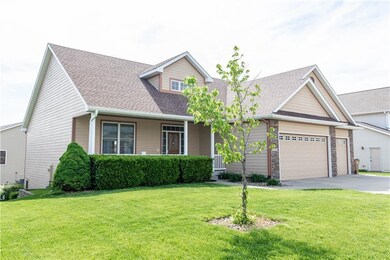
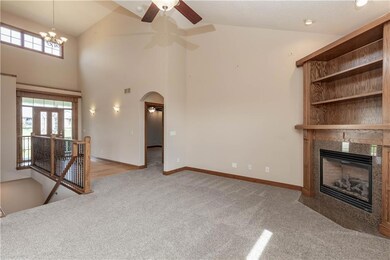
With over 3300 sq ft of finish- introducing a stunning walkout ranch home nestled in a picturesque community with a great location. Step inside to the open concept floor plan & be greeted by 22' vaulted ceilings & natural light, highlighting the craftsmanship & attention to detail in this beautiful custom home. Step into spacious kitchen with updated custom cabinets, counter tops and breakfast bar that oversees your large deck. Main level featuring our Primary BR with double closets/closet systems and walk in. Rejuvenate in Private bath with walk-in shower and double vanities. Step into a world of possibilities with a finished walkout lower level with a wet bar, pool table area, game area and a way to watch your favorite movies in the movie theater style area. You'll get direct access to a walkout patio with a spacious fenced in backyard. 3 car garage with a drain, central vac, irrigation, intercom and a new roof (asphalt GAF 10/21) New water heater (5/23) as well as new carpet.
| Date | Buyer | Sale Price | Title Company |
|---|---|---|---|
| Bell Sonia | $415,000 | None Listed On Document | |
| Moran Patrick J | $310,500 | Itc | |
| Master Crafted Homes Inc | $45,500 | -- |
| Date | Status | Borrower | Loan Amount |
|---|---|---|---|
| Closed | Bell Sonia | $145,250 | |
| Open | Bell Sonia | $249,000 | |
| Previous Owner | Moran Patrick J | $317,550 |
| Date | Event | Price | List to Sale | Price per Sq Ft |
|---|---|---|---|---|
| 06/26/2024 06/26/24 | Sold | $415,000 | -2.3% | $236 / Sq Ft |
| 09/07/2023 09/07/23 | Pending | -- | -- | -- |
| 07/21/2023 07/21/23 | Price Changed | $424,900 | -1.2% | $242 / Sq Ft |
| 06/28/2023 06/28/23 | Price Changed | $430,000 | -1.8% | $245 / Sq Ft |
| 05/30/2023 05/30/23 | Price Changed | $437,900 | -1.6% | $249 / Sq Ft |
| 05/17/2023 05/17/23 | For Sale | $445,000 | -- | $253 / Sq Ft |
| Year | Tax Paid | Tax Assessment Tax Assessment Total Assessment is a certain percentage of the fair market value that is determined by local assessors to be the total taxable value of land and additions on the property. | Land | Improvement |
|---|---|---|---|---|
| 2025 | $9,058 | $461,200 | $70,400 | $390,800 |
| 2024 | $9,058 | $503,600 | $67,000 | $436,600 |
| 2023 | $7,960 | $503,600 | $67,000 | $436,600 |
| 2022 | $8,012 | $374,900 | $53,200 | $321,700 |
| 2021 | $8,214 | $374,900 | $53,200 | $321,700 |
| 2020 | $8,080 | $371,500 | $50,300 | $321,200 |
| 2019 | $8,006 | $371,500 | $50,300 | $321,200 |
| 2018 | $8,270 | $345,700 | $44,800 | $300,900 |
| 2017 | $8,038 | $345,700 | $44,800 | $300,900 |
| 2016 | $7,700 | $328,400 | $40,800 | $287,600 |
| 2015 | $7,700 | $328,400 | $40,800 | $287,600 |
| 2014 | $6,928 | $301,300 | $36,800 | $264,500 |
J
Seller's Agent in 2024
Jordan Lee
1 Percent Lists Evolution
(641) 745-0216
2 in this area
64 Total Sales

Buyer's Agent in 2024
Lisa Vance
LPT Realty, LLC
(303) 809-9492
6 in this area
173 Total Sales
Source: Des Moines Area Association of REALTORS®
MLS Number: 673403
APN: 311-00173739131
Disclaimer: Certain information contained herein is derived from information provided by parties other than Homes.com. All information provided is deemed reliable, but is not guaranteed to be accurate and should be independently verified.
![]() IDX information is provided exclusively for personal, non-commercial use, and may not be used for any purpose other than to identify prospective properties consumers may be interested in purchasing. Information is deemed reliable but not guaranteed.
IDX information is provided exclusively for personal, non-commercial use, and may not be used for any purpose other than to identify prospective properties consumers may be interested in purchasing. Information is deemed reliable but not guaranteed.