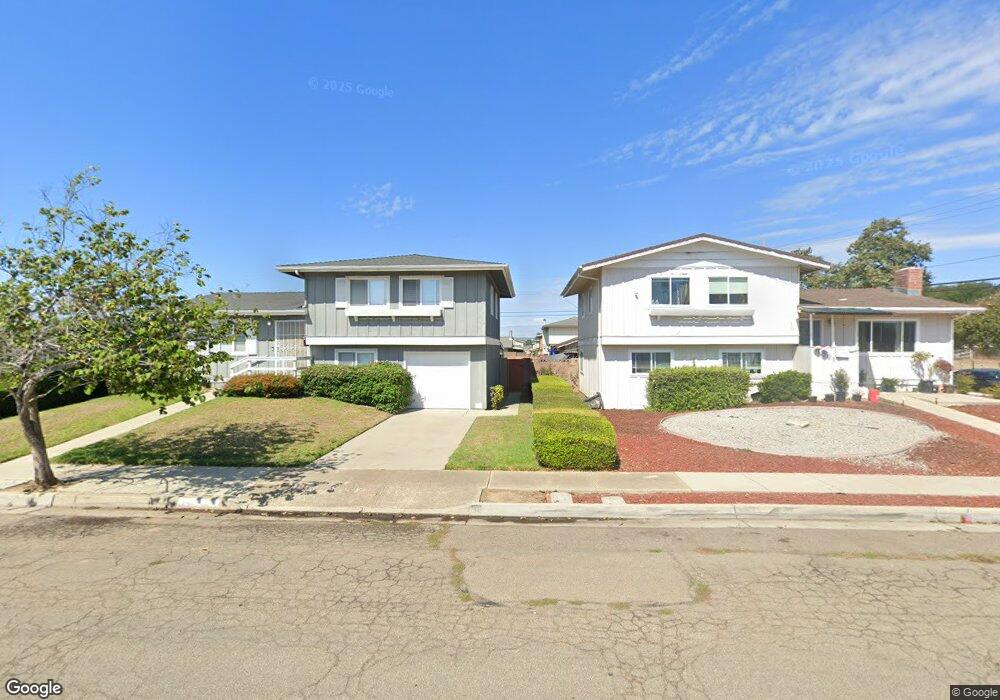
1505 W Cherry Ave Lompoc, CA 93436
Estimated Value: $562,238 - $589,000
3
Beds
2
Baths
1,399
Sq Ft
$412/Sq Ft
Est. Value
About This Home
This home is located at 1505 W Cherry Ave, Lompoc, CA 93436 and is currently estimated at $576,310, approximately $411 per square foot. 1505 W Cherry Ave is a home located in Santa Barbara County with nearby schools including Clarence Ruth Elementary School, Lompoc Valley Middle School, and Lompoc High School.
Ownership History
Date
Name
Owned For
Owner Type
Purchase Details
Closed on
Jul 22, 2024
Sold by
Carroll James
Bought by
Carroll John E and Carroll Tracy L
Current Estimated Value
Purchase Details
Closed on
Oct 14, 2022
Sold by
Lamas Morgan
Bought by
Carroll James
Home Financials for this Owner
Home Financials are based on the most recent Mortgage that was taken out on this home.
Original Mortgage
$162,000
Interest Rate
6.92%
Purchase Details
Closed on
Oct 13, 2022
Sold by
Nevart Carroll Living Trust
Bought by
Carroll James and Carroll John
Home Financials for this Owner
Home Financials are based on the most recent Mortgage that was taken out on this home.
Original Mortgage
$162,000
Interest Rate
6.92%
Purchase Details
Closed on
Jul 5, 2007
Sold by
Carroll Nevart
Bought by
Nevart Carroll Living Trust and Carroll Nevart
Create a Home Valuation Report for This Property
The Home Valuation Report is an in-depth analysis detailing your home's value as well as a comparison with similar homes in the area
Home Values in the Area
Average Home Value in this Area
Purchase History
| Date | Buyer | Sale Price | Title Company |
|---|---|---|---|
| Carroll John E | -- | None Listed On Document | |
| Carroll James | -- | Placer Title | |
| Carroll James | -- | Placer Title | |
| Nevart Carroll Living Trust | -- | None Available |
Source: Public Records
Mortgage History
| Date | Status | Borrower | Loan Amount |
|---|---|---|---|
| Previous Owner | Carroll James | $162,000 | |
| Previous Owner | Carroll James | $162,000 |
Source: Public Records
Tax History
| Year | Tax Paid | Tax Assessment Tax Assessment Total Assessment is a certain percentage of the fair market value that is determined by local assessors to be the total taxable value of land and additions on the property. | Land | Improvement |
|---|---|---|---|---|
| 2025 | $5,378 | $512,796 | $162,374 | $350,422 |
| 2023 | $5,378 | $475,000 | $150,000 | $325,000 |
| 2022 | $591 | $55,165 | $14,121 | $41,044 |
| 2021 | $593 | $54,085 | $13,845 | $40,240 |
| 2020 | $587 | $53,532 | $13,704 | $39,828 |
| 2019 | $574 | $52,484 | $13,436 | $39,048 |
| 2018 | $563 | $51,456 | $13,173 | $38,283 |
| 2017 | $551 | $50,448 | $12,915 | $37,533 |
| 2016 | $539 | $49,460 | $12,662 | $36,798 |
| 2014 | $525 | $47,764 | $12,228 | $35,536 |
Source: Public Records
Map
Nearby Homes
- 600 N Y St
- 516 N U St
- 1103 Point Sal Loop
- 420 N W St
- 1012 W Anthony Way
- 1355 Crown Cir
- 2205 Point Sal Loop
- 901 Alden Ave
- 1416 Glen Ellen Ln
- 1212 Timothy Ct
- 321 N Z St
- 531 N O St
- 1344 Village Meadows Dr
- 267 Village Circle Dr
- 1408 W Walnut Ave
- 1011 W Walnut Ave
- 112 N X St
- 526 N L St
- 1410 W Apricot Ave
- 321 W North Ave Unit 133
- 1509 W Cherry Ave
- 1501 W Cherry Ave
- 1513 W Cherry Ave
- 1504 W Oak Ave
- 1500 W Oak Ave
- 1508 W Oak Ave
- 1504 W Cherry Ave
- 1512 W Oak Ave
- 1508 W Cherry Ave
- 1500 W Cherry Ave
- 1517 W Cherry Ave
- 1512 W Cherry Ave
- 1516 W Oak Ave
- 1516 W Cherry Ave
- 1520 W Oak Ave
- 1505 W Oak Ave
- 1505 W Pine Ave
- 1501 W Oak Ave
- 1509 W Pine Ave
Your Personal Tour Guide
Ask me questions while you tour the home.