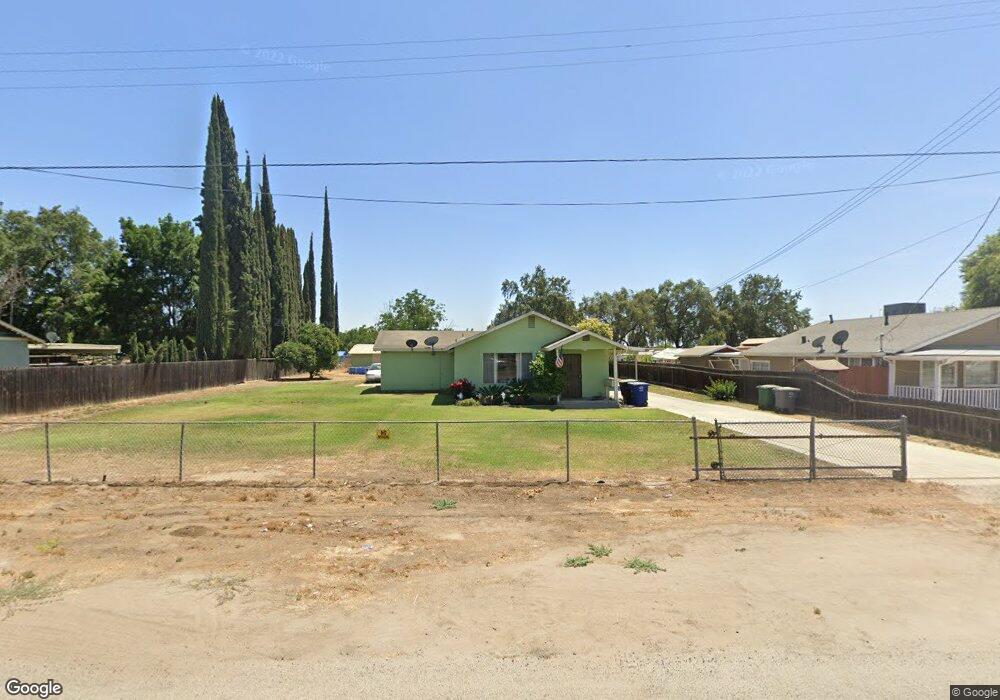
15053 Water Ave Visalia, CA 93292
Estimated Value: $232,000 - $336,000
--
Bed
--
Bath
1,331
Sq Ft
$196/Sq Ft
Est. Value
About This Home
This home is located at 15053 Water Ave, Visalia, CA 93292 and is currently estimated at $260,456, approximately $195 per square foot. 15053 Water Ave is a home located in Tulare County with nearby schools including Annie R. Mitchell Elementary School, Divisadero Middle School, and Mt. Whitney High School.
Ownership History
Date
Name
Owned For
Owner Type
Purchase Details
Closed on
Aug 21, 2007
Sold by
Lindsey Irene M
Bought by
Lindsey Irene M and Irene M Lindsey Revocable Trust
Current Estimated Value
Purchase Details
Closed on
Jul 27, 2004
Sold by
Smith Glen
Bought by
Lindsey Irene M
Purchase Details
Closed on
Jul 9, 2004
Sold by
Smith Dale
Bought by
Smith Roberta
Purchase Details
Closed on
Jun 24, 2004
Sold by
Peck Norma
Bought by
Peck Wesley
Purchase Details
Closed on
Jun 22, 2004
Sold by
Knutson Erik
Bought by
Knutson Debra
Purchase Details
Closed on
Jun 21, 2004
Sold by
Underwood Charles
Bought by
Underwood Pauline
Purchase Details
Closed on
Jun 18, 2004
Sold by
Hobson David
Bought by
Hobson Geraldine
Purchase Details
Closed on
Jun 17, 2004
Sold by
Peck Barbara
Bought by
Peck Thomas
Purchase Details
Closed on
May 19, 2004
Sold by
Underwood Pauline
Bought by
Lindsey Irene M
Create a Home Valuation Report for This Property
The Home Valuation Report is an in-depth analysis detailing your home's value as well as a comparison with similar homes in the area
Home Values in the Area
Average Home Value in this Area
Purchase History
| Date | Buyer | Sale Price | Title Company |
|---|---|---|---|
| Lindsey Irene M | -- | None Available | |
| Lindsey Irene M | -- | Stewart Title Of California | |
| Smith Roberta | -- | Stewart Title Of California | |
| Peck Wesley | -- | Stewart Title Of California | |
| Knutson Debra | -- | Stewart Title Of California | |
| Underwood Pauline | -- | Stewart Title Of California | |
| Hobson Geraldine | -- | Stewart Title Of California | |
| Peck Thomas | -- | Stewart Title Of California | |
| Lindsey Irene M | $80,000 | Stewart Title Of California |
Source: Public Records
Tax History Compared to Growth
Tax History
| Year | Tax Paid | Tax Assessment Tax Assessment Total Assessment is a certain percentage of the fair market value that is determined by local assessors to be the total taxable value of land and additions on the property. | Land | Improvement |
|---|---|---|---|---|
| 2025 | $1,183 | $111,511 | $48,786 | $62,725 |
| 2024 | $1,183 | $109,326 | $47,830 | $61,496 |
| 2023 | $1,151 | $107,184 | $46,893 | $60,291 |
| 2022 | $1,099 | $105,083 | $45,974 | $59,109 |
| 2021 | $1,101 | $103,023 | $45,073 | $57,950 |
| 2020 | $1,086 | $101,967 | $44,611 | $57,356 |
| 2019 | $1,061 | $99,967 | $43,736 | $56,231 |
| 2018 | $1,028 | $98,006 | $42,878 | $55,128 |
| 2017 | $1,024 | $96,084 | $42,037 | $54,047 |
| 2016 | $998 | $94,200 | $41,213 | $52,987 |
| 2015 | $970 | $92,785 | $40,594 | $52,191 |
| 2014 | $970 | $90,968 | $39,799 | $51,169 |
Source: Public Records
Map
Nearby Homes
- 28020 Road 148
- 896 N Mariposa Ave
- 245 W Oakland St
- 146 S Farmersville Blvd
- 15061 Avenue 288
- 3000 S Arkle St
- 327 S Farmersville Blvd
- 2242 S Manzanita Ct
- 209 S Magnolia Ave
- 528 S Camelia Ave
- 3541 E Laura Ct
- 2338 E Chestnut Ct
- 3214 E Evergreen Ave
- 3117 E Evergreen Ave
- 3138 E Evergreen Ave
- 3130 E Evergreen Ave
- 3147 E Evergreen Ave
- 2440 S Aubree St
- 15043 Water Ave
- 15067 Water Ave
- 15050 Water Ave
- 15066 Water Ave
- 15077 Water Ave
- 15025 Water Ave
- 15080 Water Ave
- 15040 Water Ave
- 15026 Water Ave
- 15098 Water Ave
- 15010 Water Ave
- 27459 Road 150
- 14991 Water Ave
- 15011 Water Ave
- 15124 Water Ave
- 14976 Water Ave
- 27489 Road 150
- 15075 Oscar Ave
- 27514 Road 150
- 15140 Water Ave