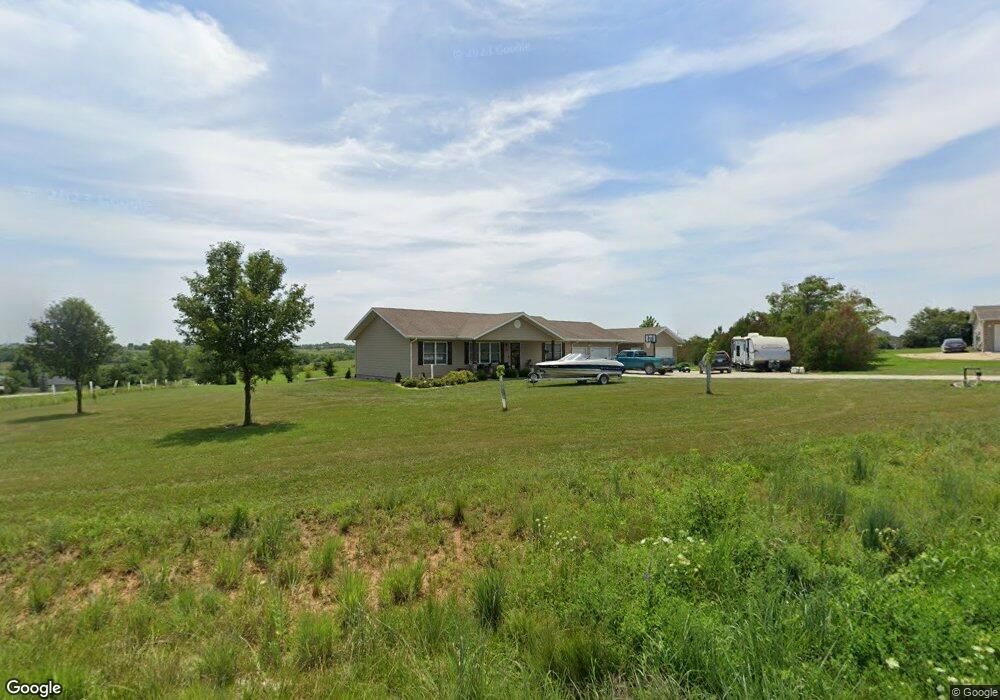
15060 Kylee Ct Wamego, KS 66547
Estimated Value: $338,000 - $401,786
4
Beds
3
Baths
2,688
Sq Ft
$133/Sq Ft
Est. Value
About This Home
This home is located at 15060 Kylee Ct, Wamego, KS 66547 and is currently estimated at $357,197, approximately $132 per square foot. 15060 Kylee Ct is a home located in Pottawatomie County with nearby schools including Rock Creek Junior/Senior High School.
Ownership History
Date
Name
Owned For
Owner Type
Purchase Details
Closed on
Jul 18, 2014
Sold by
Etienne Randal
Bought by
Reitz Anthony J and Reitz Desirae D
Current Estimated Value
Home Financials for this Owner
Home Financials are based on the most recent Mortgage that was taken out on this home.
Original Mortgage
$181,600
Interest Rate
4.23%
Purchase Details
Closed on
Jun 20, 2012
Sold by
Newell Damon L and Newell Kimberly K
Bought by
Etienne Randal
Home Financials for this Owner
Home Financials are based on the most recent Mortgage that was taken out on this home.
Original Mortgage
$168,000
Interest Rate
3.79%
Purchase Details
Closed on
Jun 9, 2005
Sold by
Gardner Douglas and Gardner Jamie L
Bought by
Newell Damon L and Newell Kimberly K
Home Financials for this Owner
Home Financials are based on the most recent Mortgage that was taken out on this home.
Original Mortgage
$140,000
Interest Rate
5.67%
Mortgage Type
Small Business Administration
Create a Home Valuation Report for This Property
The Home Valuation Report is an in-depth analysis detailing your home's value as well as a comparison with similar homes in the area
Home Values in the Area
Average Home Value in this Area
Purchase History
| Date | Buyer | Sale Price | Title Company |
|---|---|---|---|
| Reitz Anthony J | -- | None Available | |
| Etienne Randal | -- | None Available | |
| Newell Damon L | -- | None Available |
Source: Public Records
Mortgage History
| Date | Status | Borrower | Loan Amount |
|---|---|---|---|
| Previous Owner | Reitz Anthony J | $181,600 | |
| Previous Owner | Etienne Randal | $168,000 | |
| Previous Owner | Newell Damon L | $140,000 |
Source: Public Records
Tax History Compared to Growth
Tax History
| Year | Tax Paid | Tax Assessment Tax Assessment Total Assessment is a certain percentage of the fair market value that is determined by local assessors to be the total taxable value of land and additions on the property. | Land | Improvement |
|---|---|---|---|---|
| 2025 | $3,525 | $37,941 | $4,763 | $33,178 |
| 2024 | $35 | $36,646 | $4,890 | $31,756 |
| 2023 | $3,475 | $34,581 | $4,890 | $29,691 |
| 2022 | $2,743 | $30,295 | $4,457 | $25,838 |
| 2021 | $2,743 | $27,247 | $4,310 | $22,937 |
| 2020 | $2,743 | $27,085 | $4,310 | $22,775 |
| 2019 | $2,831 | $27,582 | $4,138 | $23,444 |
| 2018 | $2,912 | $27,554 | $4,138 | $23,416 |
| 2017 | $2,517 | $26,878 | $3,700 | $23,178 |
| 2016 | $2,416 | $26,691 | $4,065 | $22,626 |
| 2015 | -- | $26,401 | $4,065 | $22,336 |
| 2014 | -- | $23,713 | $3,104 | $20,609 |
Source: Public Records
Map
Nearby Homes
- 5632 Legends View Dr
- 14373 Prairie Trail
- 14409 Wildwood Cir
- 14578 Wildwood Cir
- 14380 Prairie Trail
- 14452 Wildwood Cir
- 14391 Prairie Trail
- 14470 Wildwood Cir
- 14434 Wildwood Cir
- 14416 Wildwood Cir
- 00000 Prairie Trail
- 14200 Prairie Trail
- 00000 Prairie Trail (Lot #3)
- 14362 Prairie W
- 14344 Prairie W
- 14398 Prairie W
- 14371 Prairie Fire Ln
- 14226 Prairie W
- 4320 Rebecca Ln
- 16755 Say Rd
- 15048 Kylee Ct
- 15055 Kylee Ct
- 5721 Colton Cir
- 15015 Elm Slough Rd
- 5687 Colton Cir
- 15105 Elm Slough Rd
- 15067 Kylee Ct
- 5625 Colton Cir
- 5745 Colton Cir
- 5750 Colton Cir
- 15100 Prairie View Cir
- 15120 Prairie View Cir
- 15165 Elm Slough Rd
- 5750 Prairie View Rd
- 0 Elm Slough Rd
- 5770 Prairie View Rd
- 15160 Prairie View Cir
- 15140 Prairie View Cir
- 15105 Prairie View Cir
- 15208 Legends Point