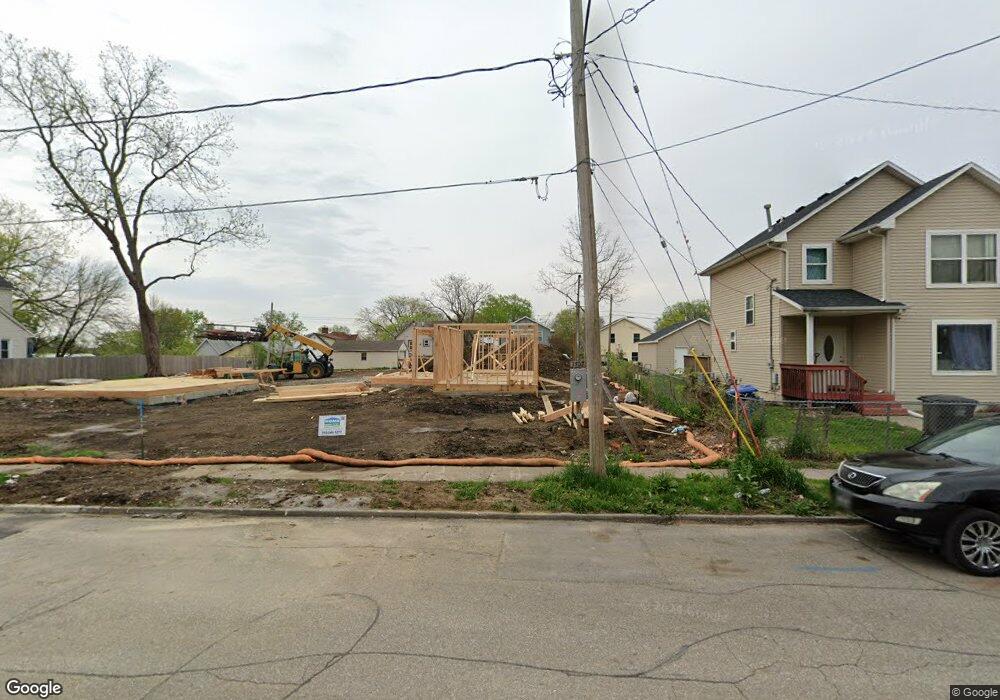
1507 11th St Des Moines, IA 50314
King Irving NeighborhoodEstimated Value: $216,000 - $260,000
3
Beds
2
Baths
1,409
Sq Ft
$166/Sq Ft
Est. Value
About This Home
This home is located at 1507 11th St, Des Moines, IA 50314 and is currently estimated at $234,253, approximately $166 per square foot. 1507 11th St is a home located in Polk County with nearby schools including Moulton Elementary School, Harding Middle School, and North High School.
Ownership History
Date
Name
Owned For
Owner Type
Purchase Details
Closed on
May 11, 2023
Sold by
A To Z Development Llc
Bought by
Home Opportunities Made Easy Inc
Current Estimated Value
Purchase Details
Closed on
Apr 20, 2019
Sold by
Rhc 12 Llc
Bought by
A To Z Development Llc
Purchase Details
Closed on
Apr 12, 2019
Sold by
County Of Polk
Bought by
Rhc 12 Llc
Purchase Details
Closed on
Nov 26, 2003
Sold by
Eppard Investment Inc
Bought by
Ucr 9 Investment Inc
Purchase Details
Closed on
Dec 19, 2002
Sold by
Eppard Investment Inc
Bought by
Rice Neighbors Rozinna Maria
Home Financials for this Owner
Home Financials are based on the most recent Mortgage that was taken out on this home.
Original Mortgage
$44,733
Interest Rate
11%
Mortgage Type
Seller Take Back
Purchase Details
Closed on
Jan 21, 2002
Sold by
Key Realty Inc
Bought by
Eppard Investments Inc
Purchase Details
Closed on
May 17, 1999
Sold by
Eppard Investment Inc
Bought by
Armstrong Jenny Marie and Armstrong James Lee
Home Financials for this Owner
Home Financials are based on the most recent Mortgage that was taken out on this home.
Original Mortgage
$45,400
Interest Rate
11%
Purchase Details
Closed on
Oct 21, 1998
Sold by
Key Realty Inc
Bought by
Eppard Investments Inc
Purchase Details
Closed on
Aug 4, 1998
Sold by
Johnson Maribel E and Wininger Maribel E
Bought by
Key Realty Inc
Create a Home Valuation Report for This Property
The Home Valuation Report is an in-depth analysis detailing your home's value as well as a comparison with similar homes in the area
Home Values in the Area
Average Home Value in this Area
Purchase History
| Date | Buyer | Sale Price | Title Company |
|---|---|---|---|
| Home Opportunities Made Easy Inc | $10,500 | None Listed On Document | |
| A To Z Development Llc | $5,000 | None Available | |
| Rhc 12 Llc | -- | None Available | |
| Ucr 9 Investment Inc | -- | -- | |
| Rice Neighbors Rozinna Maria | $44,733 | -- | |
| Eppard Investments Inc | $8,500 | -- | |
| Armstrong Jenny Marie | $49,500 | -- | |
| Eppard Investments Inc | $9,000 | -- | |
| Key Realty Inc | -- | -- |
Source: Public Records
Mortgage History
| Date | Status | Borrower | Loan Amount |
|---|---|---|---|
| Previous Owner | Rice Neighbors Rozinna Maria | $44,733 | |
| Previous Owner | Armstrong Jenny Marie | $45,400 |
Source: Public Records
Tax History Compared to Growth
Tax History
| Year | Tax Paid | Tax Assessment Tax Assessment Total Assessment is a certain percentage of the fair market value that is determined by local assessors to be the total taxable value of land and additions on the property. | Land | Improvement |
|---|---|---|---|---|
| 2025 | $76 | $223,800 | $14,000 | $209,800 |
| 2024 | $76 | $12,000 | $12,000 | -- |
| 2023 | $76 | $4,200 | $4,200 | $0 |
| 2022 | $654 | $3,200 | $3,200 | $0 |
| 2021 | $616 | $28,000 | $4,000 | $24,000 |
| 2020 | $640 | $24,700 | $3,500 | $21,200 |
| 2019 | $1,806 | $24,700 | $3,500 | $21,200 |
| 2018 | $1,937 | $41,400 | $3,100 | $38,300 |
| 2017 | $1,724 | $41,400 | $3,100 | $38,300 |
| 2016 | $1,833 | $41,800 | $3,100 | $38,700 |
| 2015 | $1,102 | $41,800 | $3,100 | $38,700 |
| 2014 | $1,734 | $37,200 | $3,100 | $34,100 |
Source: Public Records
Map
Nearby Homes