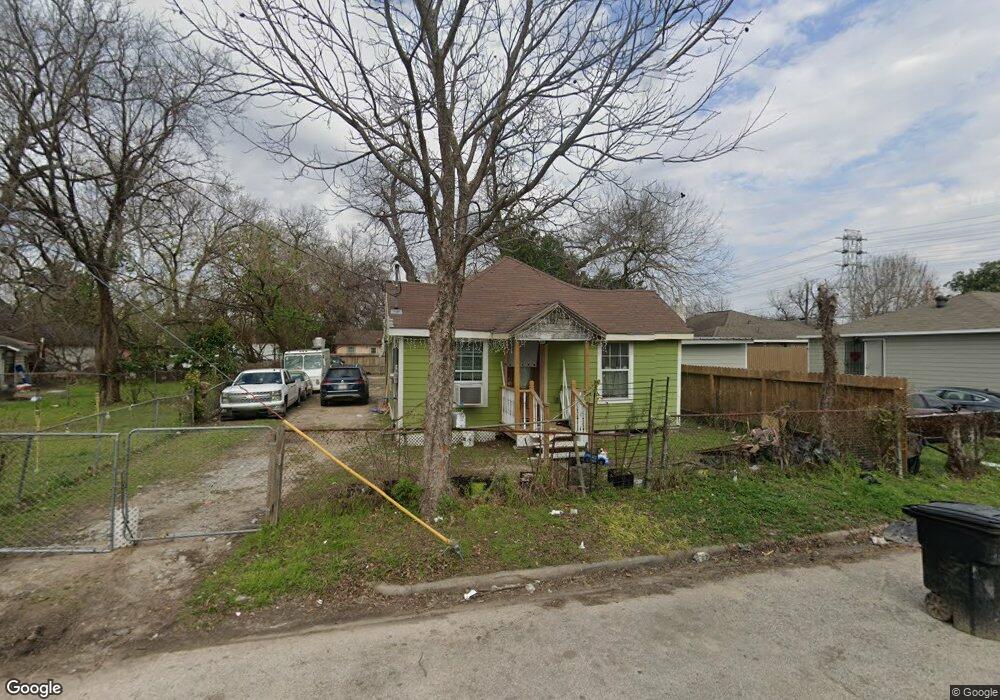
1507 Griffin St Houston, TX 77009
Ryon NeighborhoodEstimated Value: $180,000 - $220,000
1
Bed
1
Bath
576
Sq Ft
$356/Sq Ft
Est. Value
About This Home
This home is located at 1507 Griffin St, Houston, TX 77009 and is currently estimated at $204,950, approximately $355 per square foot. 1507 Griffin St is a home located in Harris County with nearby schools including Jefferson Elementary School, Marshall Middle, and Northside High School.
Ownership History
Date
Name
Owned For
Owner Type
Purchase Details
Closed on
Sep 26, 2016
Sold by
Diego Hilaro
Bought by
Espinosa Imelda Espinosa
Current Estimated Value
Purchase Details
Closed on
Sep 6, 2011
Sold by
Sukkot Lp
Bought by
Palacios Jonathan Edward
Purchase Details
Closed on
Feb 5, 2010
Sold by
Stewart Jessie Mae and Shelvin Patricia Stewart
Bought by
County Of Harris
Purchase Details
Closed on
Jan 24, 1994
Sold by
Stepney Blanche Randle and Randle Rosie Lee
Bought by
Stewart Jessie M
Create a Home Valuation Report for This Property
The Home Valuation Report is an in-depth analysis detailing your home's value as well as a comparison with similar homes in the area
Home Values in the Area
Average Home Value in this Area
Purchase History
| Date | Buyer | Sale Price | Title Company |
|---|---|---|---|
| Espinosa Imelda Espinosa | -- | None Available | |
| Palacios Jonathan Edward | -- | None Available | |
| County Of Harris | -- | None Available | |
| Stewart Jessie M | -- | -- |
Source: Public Records
Tax History Compared to Growth
Tax History
| Year | Tax Paid | Tax Assessment Tax Assessment Total Assessment is a certain percentage of the fair market value that is determined by local assessors to be the total taxable value of land and additions on the property. | Land | Improvement |
|---|---|---|---|---|
| 2025 | $4,201 | $202,022 | $168,750 | $33,272 |
| 2024 | $4,201 | $200,766 | $168,750 | $32,016 |
| 2023 | $3,557 | $176,538 | $140,625 | $35,913 |
| 2022 | $3,887 | $176,538 | $140,625 | $35,913 |
| 2021 | $2,949 | $126,539 | $95,625 | $30,914 |
| 2020 | $3,092 | $127,691 | $95,625 | $32,066 |
| 2019 | $3,231 | $127,691 | $95,625 | $32,066 |
| 2018 | $2,484 | $98,175 | $67,500 | $30,675 |
| 2017 | $2,175 | $86,023 | $56,250 | $29,773 |
| 2016 | $1,668 | $65,981 | $50,625 | $15,356 |
| 2015 | $1,001 | $47,184 | $30,938 | $16,246 |
| 2014 | $1,001 | $38,934 | $25,313 | $13,621 |
Source: Public Records
Map
Nearby Homes