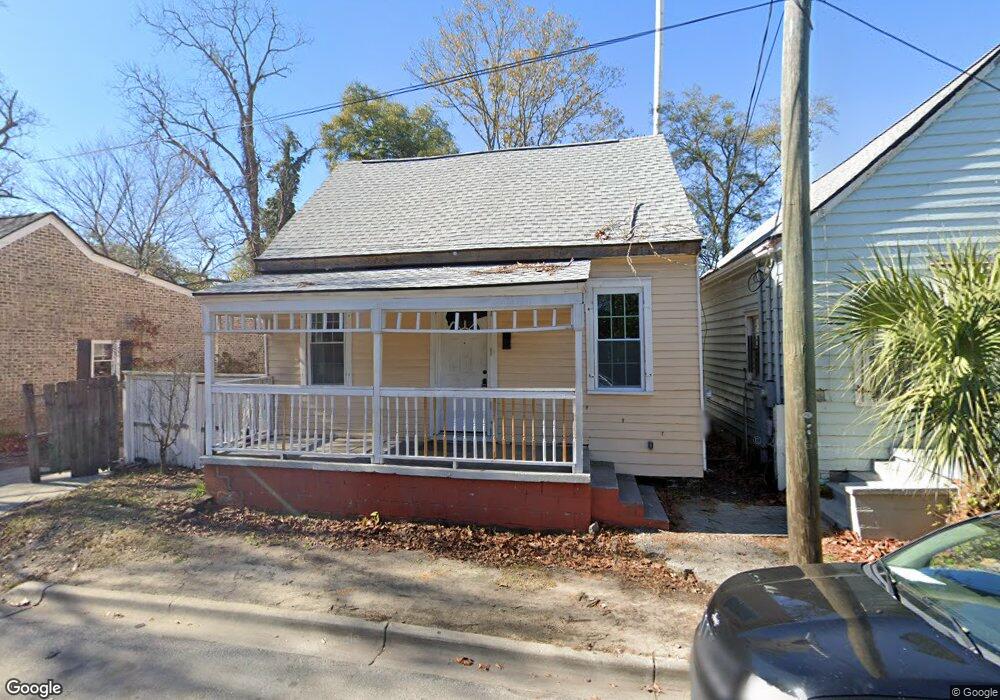
1507 Grove St Savannah, GA 31401
Midtown Savannah NeighborhoodEstimated Value: $169,964 - $270,000
2
Beds
1
Bath
640
Sq Ft
$335/Sq Ft
Est. Value
About This Home
This home is located at 1507 Grove St, Savannah, GA 31401 and is currently estimated at $214,241, approximately $334 per square foot. 1507 Grove St is a home located in Chatham County with nearby schools including Shuman Elementary School, Hubert Middle School, and Savannah Arts Academy.
Ownership History
Date
Name
Owned For
Owner Type
Purchase Details
Closed on
Jun 9, 2010
Sold by
Grove Street Properties Ll
Bought by
Growe Amy L
Current Estimated Value
Home Financials for this Owner
Home Financials are based on the most recent Mortgage that was taken out on this home.
Original Mortgage
$36,640
Interest Rate
4.3%
Mortgage Type
New Conventional
Purchase Details
Closed on
Mar 4, 2006
Sold by
Not Provided
Bought by
Growe Amy L
Create a Home Valuation Report for This Property
The Home Valuation Report is an in-depth analysis detailing your home's value as well as a comparison with similar homes in the area
Home Values in the Area
Average Home Value in this Area
Purchase History
| Date | Buyer | Sale Price | Title Company |
|---|---|---|---|
| Growe Amy L | $45,800 | -- | |
| Growe Amy L | -- | -- |
Source: Public Records
Mortgage History
| Date | Status | Borrower | Loan Amount |
|---|---|---|---|
| Closed | Growe Amy L | $36,640 |
Source: Public Records
Tax History Compared to Growth
Tax History
| Year | Tax Paid | Tax Assessment Tax Assessment Total Assessment is a certain percentage of the fair market value that is determined by local assessors to be the total taxable value of land and additions on the property. | Land | Improvement |
|---|---|---|---|---|
| 2025 | $1,964 | $49,880 | $28,000 | $21,880 |
| 2024 | $1,964 | $49,880 | $28,000 | $21,880 |
| 2023 | $412 | $33,800 | $15,000 | $18,800 |
| 2022 | $253 | $32,000 | $15,000 | $17,000 |
| 2021 | $740 | $20,720 | $6,000 | $14,720 |
| 2020 | $479 | $15,160 | $6,000 | $9,160 |
| 2019 | $674 | $15,160 | $6,000 | $9,160 |
| 2018 | $424 | $13,400 | $6,000 | $7,400 |
| 2017 | $345 | $11,760 | $7,440 | $4,320 |
| 2016 | $331 | $11,360 | $7,440 | $3,920 |
| 2015 | $584 | $10,720 | $7,440 | $3,280 |
| 2014 | $529 | $9,520 | $0 | $0 |
Source: Public Records
Map
Nearby Homes