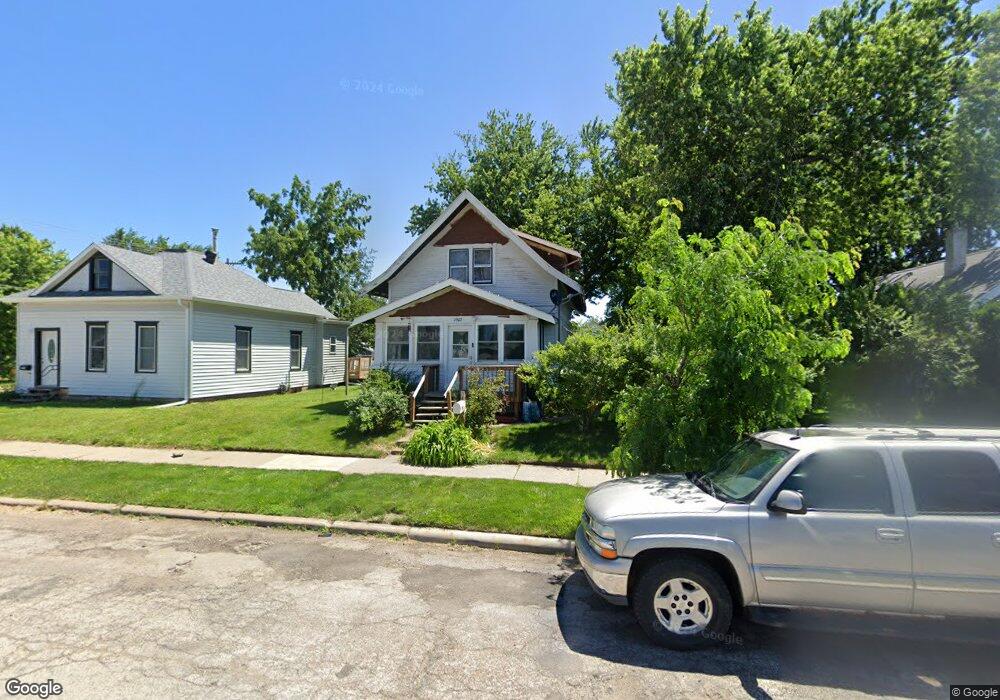
1507 K St SW Cedar Rapids, IA 52404
Taylor NeighborhoodEstimated Value: $105,000 - $139,000
3
Beds
1
Bath
1,156
Sq Ft
$102/Sq Ft
Est. Value
About This Home
This home is located at 1507 K St SW, Cedar Rapids, IA 52404 and is currently estimated at $118,432, approximately $102 per square foot. 1507 K St SW is a home located in Linn County with nearby schools including Junction City Elementary School, Cedar River Academy at Taylor Elementary School, and Bruce Hall Day Treatment Center.
Ownership History
Date
Name
Owned For
Owner Type
Purchase Details
Closed on
Dec 7, 2018
Sold by
H & R Ventures Llc
Bought by
Stickley Courtney
Current Estimated Value
Home Financials for this Owner
Home Financials are based on the most recent Mortgage that was taken out on this home.
Original Mortgage
$62,890
Outstanding Balance
$55,407
Interest Rate
4.8%
Mortgage Type
New Conventional
Estimated Equity
$63,025
Purchase Details
Closed on
Jan 24, 2012
Sold by
Ledeker Joan Ethel and Ledeker Joan E
Bought by
Randall Michael R and Randall Paulette R
Create a Home Valuation Report for This Property
The Home Valuation Report is an in-depth analysis detailing your home's value as well as a comparison with similar homes in the area
Home Values in the Area
Average Home Value in this Area
Purchase History
| Date | Buyer | Sale Price | Title Company |
|---|---|---|---|
| Stickley Courtney | $66,500 | Security First Title Co | |
| Randall Michael R | $31,500 | None Available |
Source: Public Records
Mortgage History
| Date | Status | Borrower | Loan Amount |
|---|---|---|---|
| Open | Stickley Courtney | $62,890 | |
| Closed | Stickley Courtney | $62,890 |
Source: Public Records
Tax History Compared to Growth
Tax History
| Year | Tax Paid | Tax Assessment Tax Assessment Total Assessment is a certain percentage of the fair market value that is determined by local assessors to be the total taxable value of land and additions on the property. | Land | Improvement |
|---|---|---|---|---|
| 2025 | $1,324 | $87,400 | $28,800 | $58,600 |
| 2024 | $1,402 | $89,200 | $25,000 | $64,200 |
| 2023 | $1,402 | $85,300 | $25,000 | $60,300 |
| 2022 | $1,290 | $75,300 | $25,000 | $50,300 |
| 2021 | $1,288 | $71,200 | $22,500 | $48,700 |
| 2020 | $1,176 | $67,000 | $22,500 | $44,500 |
| 2019 | $1,318 | $61,100 | $20,000 | $41,100 |
| 2018 | $1,280 | $61,100 | $20,000 | $41,100 |
| 2017 | $1,280 | $59,000 | $20,000 | $39,000 |
| 2016 | $1,374 | $64,600 | $20,000 | $44,600 |
| 2015 | $1,510 | $70,921 | $20,000 | $50,921 |
| 2014 | $1,510 | $70,921 | $20,000 | $50,921 |
| 2013 | $1,476 | $70,921 | $20,000 | $50,921 |
Source: Public Records
Map
Nearby Homes
- 192 15th Ave SW
- 280 14th Ave SW
- 1804 I St SW
- 1411 1st St SW
- 1323 M St SW
- 1435 N St SW
- 1300 M St SW
- 1756 Mallory St SW
- 1426 N St SW
- 2021 Hamilton St SW
- 186 22nd Ave SW
- 804 N St SW
- 358 8th Ave SW
- 919 6th St SW
- 411 8th Ave SW
- 914 6th St SW
- 657 16th Ave SW
- 615 4th St SW
- 2417 Illinois St SW
- 452 8th Ave SW