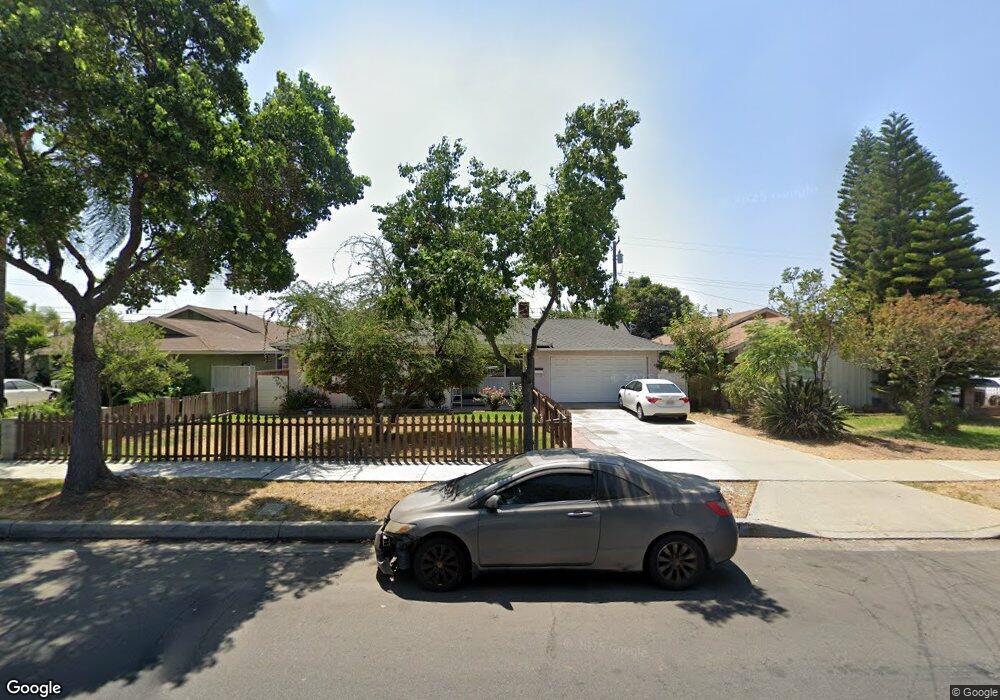
1507 W D St Ontario, CA 91762
Downtown Ontario NeighborhoodEstimated Value: $604,000 - $646,840
3
Beds
2
Baths
1,444
Sq Ft
$427/Sq Ft
Est. Value
About This Home
This home is located at 1507 W D St, Ontario, CA 91762 and is currently estimated at $616,460, approximately $426 per square foot. 1507 W D St is a home located in San Bernardino County with nearby schools including Kingsley Elementary School, Vernon Middle School, and Montclair High School.
Ownership History
Date
Name
Owned For
Owner Type
Purchase Details
Closed on
Feb 14, 2003
Sold by
Anaya Barbarito
Bought by
Anaya Barbarito
Current Estimated Value
Home Financials for this Owner
Home Financials are based on the most recent Mortgage that was taken out on this home.
Original Mortgage
$130,681
Outstanding Balance
$55,886
Interest Rate
5.93%
Mortgage Type
FHA
Estimated Equity
$560,574
Purchase Details
Closed on
Oct 12, 1999
Sold by
Socorro David Alexis and Socorro David,
Bought by
Anaya Barbarito
Home Financials for this Owner
Home Financials are based on the most recent Mortgage that was taken out on this home.
Original Mortgage
$130,722
Interest Rate
7.68%
Mortgage Type
FHA
Purchase Details
Closed on
Jun 12, 1997
Sold by
Mann Clifford A and Mann Donna J
Bought by
Socorro David Alexis and Socorro David
Home Financials for this Owner
Home Financials are based on the most recent Mortgage that was taken out on this home.
Original Mortgage
$107,362
Interest Rate
7.7%
Mortgage Type
FHA
Create a Home Valuation Report for This Property
The Home Valuation Report is an in-depth analysis detailing your home's value as well as a comparison with similar homes in the area
Home Values in the Area
Average Home Value in this Area
Purchase History
| Date | Buyer | Sale Price | Title Company |
|---|---|---|---|
| Anaya Barbarito | -- | North American Title Co | |
| Anaya Barbarito | $132,000 | First American Title Ins Co | |
| Socorro David Alexis | $115,000 | Chicago Title Co |
Source: Public Records
Mortgage History
| Date | Status | Borrower | Loan Amount |
|---|---|---|---|
| Open | Anaya Barbarito | $130,681 | |
| Closed | Anaya Barbarito | $130,722 | |
| Previous Owner | Socorro David Alexis | $107,362 |
Source: Public Records
Tax History
| Year | Tax Paid | Tax Assessment Tax Assessment Total Assessment is a certain percentage of the fair market value that is determined by local assessors to be the total taxable value of land and additions on the property. | Land | Improvement |
|---|---|---|---|---|
| 2025 | $2,168 | $202,880 | $71,007 | $131,873 |
| 2024 | $2,117 | $198,902 | $69,615 | $129,287 |
| 2023 | $2,056 | $195,002 | $68,250 | $126,752 |
| 2022 | $2,028 | $191,179 | $66,912 | $124,267 |
| 2021 | $2,013 | $187,430 | $65,600 | $121,830 |
| 2020 | $1,977 | $185,508 | $64,927 | $120,581 |
| 2019 | $1,959 | $181,871 | $63,654 | $118,217 |
| 2018 | $1,931 | $178,305 | $62,406 | $115,899 |
| 2017 | $1,860 | $174,808 | $61,182 | $113,626 |
| 2016 | $1,785 | $171,380 | $59,982 | $111,398 |
| 2015 | $1,772 | $168,806 | $59,081 | $109,725 |
| 2014 | $1,716 | $165,500 | $57,924 | $107,576 |
Source: Public Records
Map
Nearby Homes
- 1319 W D St
- 1255 W D St
- 10109 Bel Air Ave
- 5394 Evart St
- 853 N Jasmine Ave
- 1435 W Rosewood Ct
- 1411 W Mission Blvd
- 955 W G St
- 961 W Holt Blvd
- 924 W E St
- 1228 W Rosewood Ct
- 841 W B St
- 1353 W Princeton St
- 816 W G St
- 890 S Magnolia Ave
- 1307 W North Pinecrest Paseo
- 1309 W North Pinecrest Paseo
- 1326 W Oakcrest Paseo
- 1330 W Oakcrest Paseo
- 5141 Aspen Dr
Your Personal Tour Guide
Ask me questions while you tour the home.