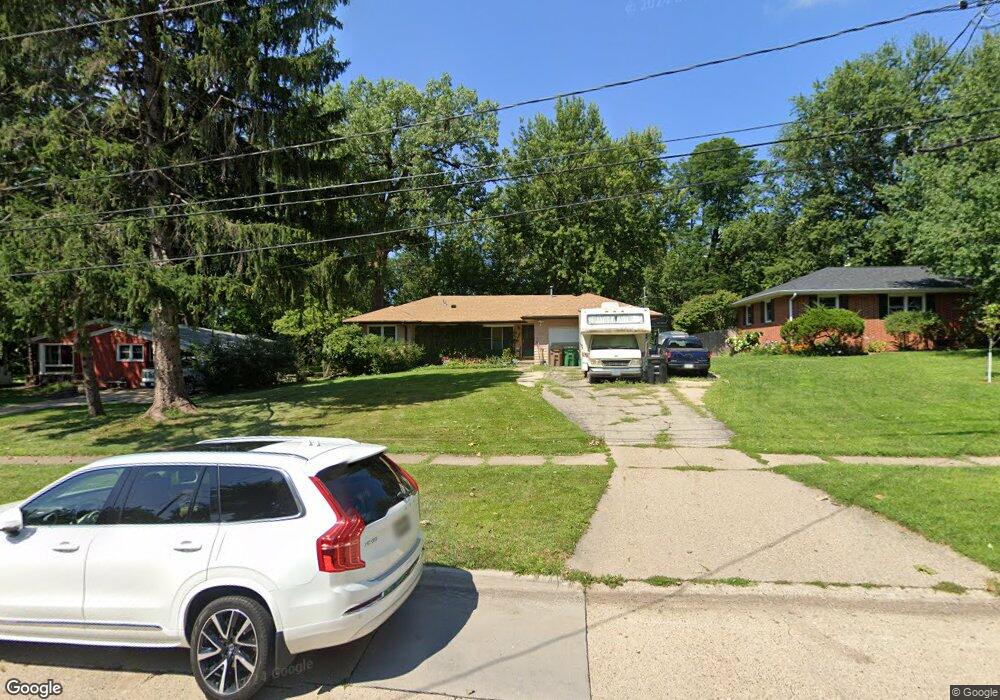
1508 17th St West Des Moines, IA 50265
Estimated Value: $271,000 - $286,000
3
Beds
2
Baths
1,280
Sq Ft
$217/Sq Ft
Est. Value
About This Home
This home is located at 1508 17th St, West Des Moines, IA 50265 and is currently estimated at $277,873, approximately $217 per square foot. 1508 17th St is a home located in Polk County with nearby schools including Indian Hills Junior High School, Valley Southwoods Freshman High School, and Valley High School.
Ownership History
Date
Name
Owned For
Owner Type
Purchase Details
Closed on
May 11, 2021
Sold by
Burright Blaine and Burright Marsha G
Bought by
Burright Blaine
Current Estimated Value
Home Financials for this Owner
Home Financials are based on the most recent Mortgage that was taken out on this home.
Original Mortgage
$92,000
Outstanding Balance
$76,002
Interest Rate
2.9%
Mortgage Type
New Conventional
Estimated Equity
$201,871
Purchase Details
Closed on
Jun 24, 2005
Sold by
Givant John Michael and Givant Kathryn Ann
Bought by
Burright Blaine and Burright Marsha G
Home Financials for this Owner
Home Financials are based on the most recent Mortgage that was taken out on this home.
Original Mortgage
$133,200
Interest Rate
5.86%
Mortgage Type
Fannie Mae Freddie Mac
Purchase Details
Closed on
Aug 28, 2002
Sold by
Staskal Patricia Ann
Bought by
Givant John Michael
Create a Home Valuation Report for This Property
The Home Valuation Report is an in-depth analysis detailing your home's value as well as a comparison with similar homes in the area
Home Values in the Area
Average Home Value in this Area
Purchase History
| Date | Buyer | Sale Price | Title Company |
|---|---|---|---|
| Burright Blaine | -- | None Available | |
| Burright Blaine | $147,500 | -- | |
| Givant John Michael | $126,500 | -- |
Source: Public Records
Mortgage History
| Date | Status | Borrower | Loan Amount |
|---|---|---|---|
| Open | Burright Blaine | $92,000 | |
| Closed | Burright Blaine | $133,200 |
Source: Public Records
Tax History Compared to Growth
Tax History
| Year | Tax Paid | Tax Assessment Tax Assessment Total Assessment is a certain percentage of the fair market value that is determined by local assessors to be the total taxable value of land and additions on the property. | Land | Improvement |
|---|---|---|---|---|
| 2025 | $3,696 | $261,900 | $74,300 | $187,600 |
| 2024 | $3,696 | $233,200 | $65,100 | $168,100 |
| 2023 | $3,668 | $233,200 | $65,100 | $168,100 |
| 2022 | $3,626 | $190,000 | $54,700 | $135,300 |
| 2021 | $3,426 | $190,000 | $54,700 | $135,300 |
| 2020 | $3,374 | $170,800 | $49,100 | $121,700 |
| 2019 | $3,218 | $170,800 | $49,100 | $121,700 |
| 2018 | $3,226 | $157,100 | $44,200 | $112,900 |
| 2017 | $3,110 | $157,100 | $44,200 | $112,900 |
| 2016 | $3,042 | $147,100 | $40,900 | $106,200 |
| 2015 | $3,042 | $147,100 | $40,900 | $106,200 |
| 2014 | $3,066 | $146,600 | $40,000 | $106,600 |
Source: Public Records
Map
Nearby Homes
- 1625 19th St
- 1827 Pleasant St
- 1705 Buffalo Rd
- 1230 16th St
- 3927 Westgate Pkwy
- 4052 NW 175th St
- 3945 Westgate Pkwy
- 3963 Westgate Pkwy
- 542 Bella St
- 2408 Pleasant St
- 1114 22nd St
- 1233 72nd St
- 1006 22nd St
- 924 13th St
- 1003 68th St
- 1008 67th St
- 1710 Plaza Cir
- 2100 Meadow Brook Dr Unit 103
- 1206 68th St
- 1516 73rd St