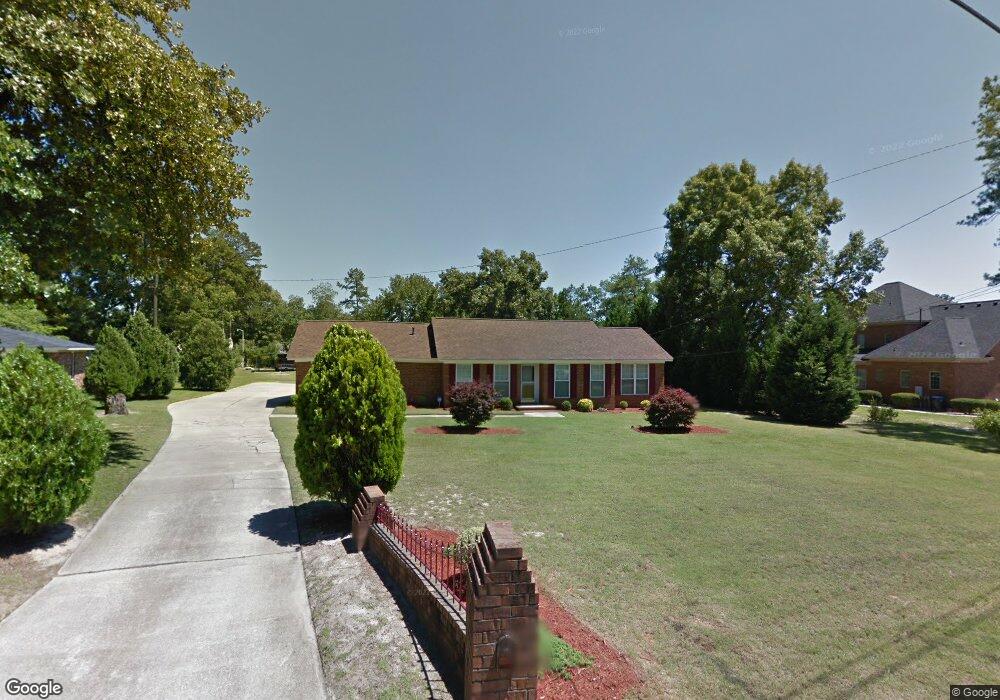
1508 Hilda Ct Augusta, GA 30909
Belair NeighborhoodEstimated Value: $228,000 - $285,000
3
Beds
2
Baths
1,761
Sq Ft
$142/Sq Ft
Est. Value
About This Home
This home is located at 1508 Hilda Ct, Augusta, GA 30909 and is currently estimated at $249,855, approximately $141 per square foot. 1508 Hilda Ct is a home located in Richmond County with nearby schools including Belair K-8 School, Johnson Magnet, and Greater Augusta Christian Academy.
Ownership History
Date
Name
Owned For
Owner Type
Purchase Details
Closed on
Sep 25, 2020
Sold by
Reynolds Phillip B
Bought by
Reynolds Pamela B
Current Estimated Value
Purchase Details
Closed on
Sep 1, 2020
Sold by
Reynolds Venoris Estate
Bought by
Reynolds Pamela B and Reynolds Phillip B
Purchase Details
Closed on
Jun 14, 2007
Sold by
Reynolds Venoris
Bought by
Reynolds Venoris and Reynolds Isaac
Purchase Details
Closed on
May 29, 1992
Sold by
Reynolds Isaac and Reynolds Venoris P
Bought by
Reynolds Isaac and Reynolds Venori
Purchase Details
Closed on
Jun 3, 1991
Sold by
Westbrook Alpha H
Bought by
Reynolds Venoris P
Purchase Details
Closed on
May 18, 1987
Sold by
Mcdonald Fred L Jr Mcdonald Raymond B M
Bought by
Reynolds Isaac Jr Reynolds Venoris
Create a Home Valuation Report for This Property
The Home Valuation Report is an in-depth analysis detailing your home's value as well as a comparison with similar homes in the area
Home Values in the Area
Average Home Value in this Area
Purchase History
| Date | Buyer | Sale Price | Title Company |
|---|---|---|---|
| Reynolds Pamela B | -- | -- | |
| Reynolds Pamela B | -- | -- | |
| Reynolds Venoris | -- | None Available | |
| Reynolds Isaac | -- | -- | |
| Reynolds Venoris P | $1,300 | -- | |
| Reynolds Isaac Jr Reynolds Venoris | $77,000 | -- |
Source: Public Records
Tax History Compared to Growth
Tax History
| Year | Tax Paid | Tax Assessment Tax Assessment Total Assessment is a certain percentage of the fair market value that is determined by local assessors to be the total taxable value of land and additions on the property. | Land | Improvement |
|---|---|---|---|---|
| 2024 | $2,538 | $79,844 | $12,000 | $67,844 |
| 2023 | $2,538 | $84,364 | $12,000 | $72,364 |
| 2022 | $2,157 | $62,900 | $12,000 | $50,900 |
| 2021 | $2,353 | $63,699 | $12,000 | $51,699 |
| 2020 | $1,008 | $57,192 | $12,000 | $45,192 |
| 2019 | $1,051 | $57,162 | $12,000 | $45,162 |
| 2018 | $1,056 | $57,162 | $12,000 | $45,162 |
| 2017 | $1,014 | $57,162 | $12,000 | $45,162 |
| 2016 | $1,014 | $57,162 | $12,000 | $45,162 |
| 2015 | $1,014 | $57,162 | $12,000 | $45,162 |
| 2014 | $2,053 | $56,922 | $12,000 | $44,922 |
Source: Public Records
Map
Nearby Homes
- 3920 Carolyn St
- 3908 Carolyn St
- 3946 Carolyn St
- 610 Porcelain Ct
- 3908 Padrick St
- 3892 Harper Franklin Ave
- 2362 Belair Spring Rd
- 4301 Leadville Ct
- 3985 Belair Rd
- 2305 Belair Spring Rd
- 4407 Silverton Rd
- 2355 Belair Spring Rd
- 2344 Belair Spring Rd
- 2339 Belair Spring Rd
- 4308 Regans Ln
- 4321 Regans Ln
- 3422 Covington Ct
- 2103 Willhaven Dr
- 2083 Willhaven Dr
- 3416 Covington Ct
- 1506 Hilda Ct
- 3915 Grape Ave
- 3913 Grape Ave
- 1511 Weaver Dr
- 1515 Weaver Dr
- 1504 Hilda Ct
- 1503 Hilda Ct
- 3919 Grape Ave
- 1509 Weaver Dr
- 1517 Weaver Dr
- 3909 Grape Ave
- 1502 Hilda Ct
- 3918 Grape Ave
- 1501 Hilda Ct
- 3914 Grape Ave
- 3922 Grape Avenue Ave
- 3922 Grape Ave
- 1503 Weaver Dr
- 1514 Weaver Dr
- 1518 Weaver Dr