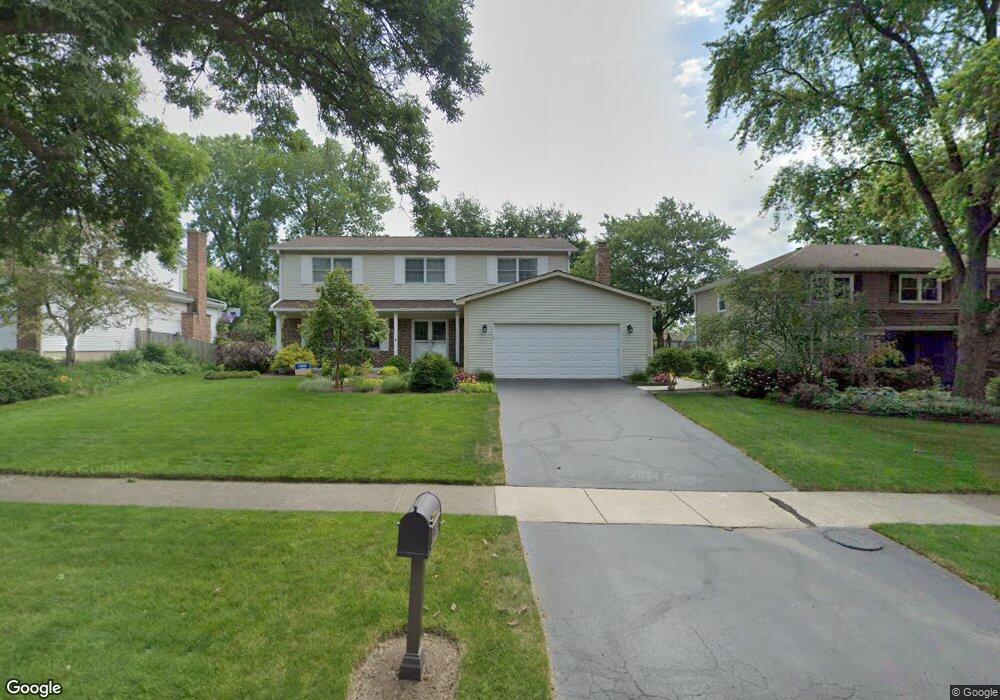
1508 Windsor Ct Naperville, IL 60565
Meadow Glens NeighborhoodEstimated Value: $619,696 - $674,000
4
Beds
3
Baths
2,400
Sq Ft
$267/Sq Ft
Est. Value
About This Home
This home is located at 1508 Windsor Ct, Naperville, IL 60565 and is currently estimated at $641,924, approximately $267 per square foot. 1508 Windsor Ct is a home located in DuPage County with nearby schools including Meadow Glens Elementary School, Madison Jr High School, and Naperville Central High School.
Ownership History
Date
Name
Owned For
Owner Type
Purchase Details
Closed on
Aug 17, 2020
Current Estimated Value
Home Financials for this Owner
Home Financials are based on the most recent Mortgage that was taken out on this home.
Original Mortgage
$199,000
Interest Rate
2.3%
Mortgage Type
New Conventional
Purchase Details
Closed on
Feb 4, 2020
Purchase Details
Closed on
May 26, 2009
Sold by
Declaration Duitsman Marianne and Declaration Marianne Duitsman
Home Financials for this Owner
Home Financials are based on the most recent Mortgage that was taken out on this home.
Original Mortgage
$285,200
Interest Rate
4.85%
Mortgage Type
Purchase Money Mortgage
Purchase Details
Closed on
Aug 24, 2007
Sold by
Duitsman Marianne
Bought by
Declaration Duitsman Marianne and Marianne Duitsman Declaration Of Trust
Purchase Details
Closed on
Sep 29, 2003
Sold by
Duitsman Timothy
Bought by
Duitsman Marianne
Create a Home Valuation Report for This Property
The Home Valuation Report is an in-depth analysis detailing your home's value as well as a comparison with similar homes in the area
Home Values in the Area
Average Home Value in this Area
Purchase History
| Date | Buyer | Sale Price | Title Company |
|---|---|---|---|
| -- | -- | None Listed On Document | |
| -- | -- | Attorney | |
| -- | $356,500 | First American Title Ins Co | |
| Declaration Duitsman Marianne | -- | First American Title Ins Co | |
| Duitsman Marianne | -- | -- |
Source: Public Records
Mortgage History
| Date | Status | Borrower | Loan Amount |
|---|---|---|---|
| Previous Owner | Mcmanamen Thomas Jerome | $199,000 | |
| Previous Owner | Mcmanamen Thomas J | $285,200 |
Source: Public Records
Tax History
| Year | Tax Paid | Tax Assessment Tax Assessment Total Assessment is a certain percentage of the fair market value that is determined by local assessors to be the total taxable value of land and additions on the property. | Land | Improvement |
|---|---|---|---|---|
| 2024 | $9,825 | $168,387 | $69,018 | $99,369 |
| 2023 | $9,466 | $153,680 | $62,990 | $90,690 |
| 2022 | $9,049 | $145,820 | $59,770 | $86,050 |
| 2021 | $8,718 | $140,310 | $57,510 | $82,800 |
| 2020 | $8,532 | $137,790 | $56,480 | $81,310 |
| 2019 | $8,282 | $131,830 | $54,040 | $77,790 |
| 2018 | $8,285 | $131,830 | $54,040 | $77,790 |
| 2017 | $8,118 | $127,390 | $52,220 | $75,170 |
| 2016 | $7,954 | $122,780 | $50,330 | $72,450 |
| 2015 | $7,903 | $115,630 | $47,400 | $68,230 |
| 2014 | $7,519 | $107,020 | $47,690 | $59,330 |
| 2013 | $7,406 | $107,270 | $47,800 | $59,470 |
Source: Public Records
Map
Nearby Homes
- 1255 E Bailey Rd
- 1612 Indian Trail Dr
- 1405 E Bailey Rd
- 1123 Mill Race Ln
- 1509 Shiva Ln
- 1285 Stonebriar Ct
- 1449 Whitespire Ct Unit 5104
- 1546 Treeline Ct Unit 405
- 1217 River Oak Dr
- 510 Harlowe Ln Unit 2001C
- 538 Harlowe Ln Unit 1801
- 8S452 Bell Dr
- 1715 Amelia Ct
- 627 Bourbon Ct
- 1583 Orchard Cir
- 621 Bourbon Ct
- 1204 Hobson Oaks Ct Unit 1204
- 1896 Appaloosa Dr Unit 7
- 1712 Coach Dr
- 144 E Bailey Rd Unit D
- 1512 Windsor Ct
- 1504 Windsor Ct Unit 4
- 1516 Windsor Ct
- 1509 Fender Rd Unit 4
- 1505 Fender Rd Unit 4
- 1116 Sara Ln
- 1511 Windsor Ct
- 1520 Windsor Ct Unit 4
- 1507 Windsor Ct
- 1503 Windsor Ct
- 1515 Fender Rd
- 1515 Windsor Ct Unit 4
- 1517 Fender Rd
- 1107 Sara Ln
- 1111 Sara Ln
- 1103 Sara Ln Unit 4
- 1519 Windsor Ct Unit 4
- 1015 Sara Ln Unit 4
- 1115 Sara Ln
- 1009 Sara Ln
Your Personal Tour Guide
Ask me questions while you tour the home.