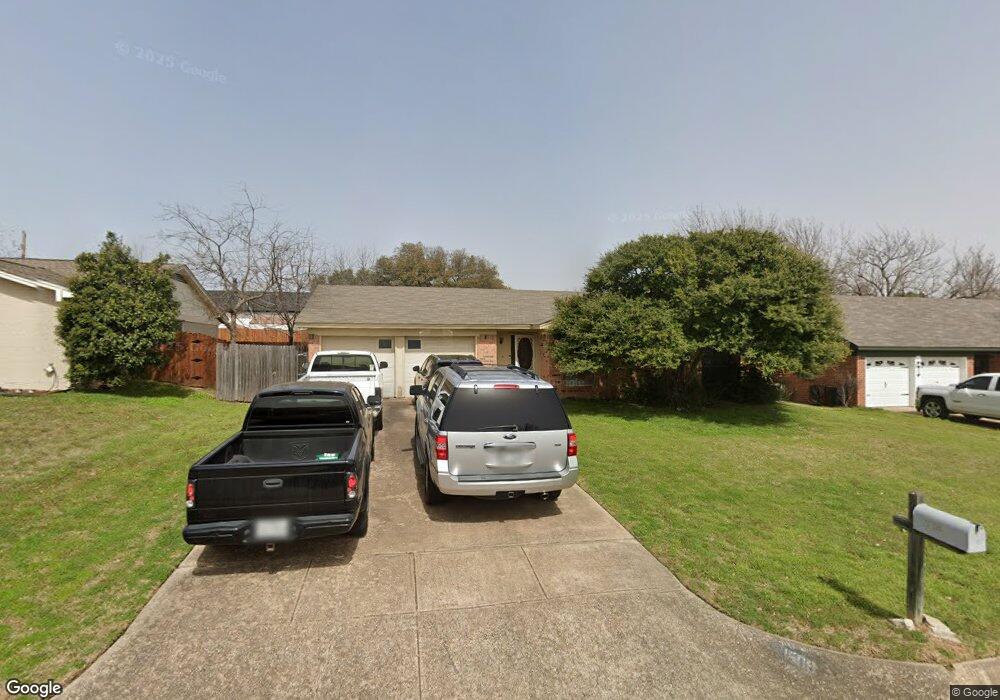
1509 Briar Run Benbrook, TX 76126
Estimated Value: $277,519 - $305,000
3
Beds
2
Baths
1,395
Sq Ft
$207/Sq Ft
Est. Value
About This Home
This home is located at 1509 Briar Run, Benbrook, TX 76126 and is currently estimated at $289,130, approximately $207 per square foot. 1509 Briar Run is a home located in Tarrant County with nearby schools including Benbrook Elementary School, Benbrook Middle/High School, and BASIS Benbrook.
Ownership History
Date
Name
Owned For
Owner Type
Purchase Details
Closed on
Jul 19, 2013
Sold by
Bales Daly R and Bales Kathleen
Bought by
Lopez Claudia T
Current Estimated Value
Home Financials for this Owner
Home Financials are based on the most recent Mortgage that was taken out on this home.
Original Mortgage
$109,900
Outstanding Balance
$69,349
Interest Rate
3.93%
Mortgage Type
Purchase Money Mortgage
Estimated Equity
$219,781
Purchase Details
Closed on
Feb 14, 2003
Sold by
Bales Daly R and Bales Kathleen
Bought by
The Boldluckk Family Partnership Ltd
Purchase Details
Closed on
Aug 4, 1999
Sold by
The Boldluckk Family Partnership Ltd
Bought by
Bales Daly R and Bales Kathleen
Home Financials for this Owner
Home Financials are based on the most recent Mortgage that was taken out on this home.
Original Mortgage
$53,900
Interest Rate
7.5%
Purchase Details
Closed on
Jan 1, 1998
Sold by
Bales Daly R and Bales Kathleen
Bought by
Bales Daly R and Bales Kathleen
Create a Home Valuation Report for This Property
The Home Valuation Report is an in-depth analysis detailing your home's value as well as a comparison with similar homes in the area
Home Values in the Area
Average Home Value in this Area
Purchase History
| Date | Buyer | Sale Price | Title Company |
|---|---|---|---|
| Lopez Claudia T | $109,900 | None Available | |
| The Boldluckk Family Partnership Ltd | -- | -- | |
| Bales Daly R | -- | Rattikin Title Co | |
| Bales Daly R | -- | -- |
Source: Public Records
Mortgage History
| Date | Status | Borrower | Loan Amount |
|---|---|---|---|
| Open | Lopez Claudia T | $109,900 | |
| Previous Owner | Bales Daly R | $53,900 |
Source: Public Records
Tax History Compared to Growth
Tax History
| Year | Tax Paid | Tax Assessment Tax Assessment Total Assessment is a certain percentage of the fair market value that is determined by local assessors to be the total taxable value of land and additions on the property. | Land | Improvement |
|---|---|---|---|---|
| 2025 | $3,647 | $262,183 | $50,000 | $212,183 |
| 2024 | $3,647 | $262,183 | $50,000 | $212,183 |
| 2023 | $4,832 | $258,638 | $35,000 | $223,638 |
| 2022 | $5,067 | $214,532 | $35,000 | $179,532 |
| 2021 | $4,858 | $190,409 | $35,000 | $155,409 |
| 2020 | $4,261 | $170,780 | $35,000 | $135,780 |
| 2019 | $4,010 | $163,224 | $35,000 | $128,224 |
| 2018 | $3,276 | $140,953 | $30,000 | $110,953 |
| 2017 | $3,368 | $136,498 | $30,000 | $106,498 |
| 2016 | $3,062 | $118,434 | $30,000 | $88,434 |
| 2015 | $2,544 | $105,900 | $22,000 | $83,900 |
| 2014 | $2,544 | $105,900 | $22,000 | $83,900 |
Source: Public Records
Map
Nearby Homes
- 1612 Prince Ct
- 1409 High Ridge Rd
- 1216 Manning St
- 1704 Prince Dr
- 1713 Prince Dr
- 1317 Concho Dr
- 1108 Briar Ct
- Pinehurst Plan at Trinity Estates
- Colonial Plan at Trinity Estates
- Oakmont Plan at Trinity Estates
- Augusta Plan at Trinity Estates
- 1617 S Timber Ct
- 1120 Tobie Layne St
- 1224 Concho Dr
- 1329 Lampasas Dr
- 1120 Forest Creek St
- 1008 Forest Creek St
- 1112 Forest Creek St
- 1125 Forest Creek St
- 1209 Juniper Ln
- 1513 Briar Run
- 1501 Briar Run
- 1504 Trammell Dr
- 1512 Trammell Dr
- 1517 Briar Run
- 1504 Briar Run
- 1508 Briar Run
- 1500 Trammell Dr
- 1516 Trammell Dr
- 1500 Briar Run
- 1512 Briar Run
- 1425 Briar Run
- 1521 Briar Run
- 1424 Trammell Dr
- 1424 Briar Run
- 1520 Trammell Dr
- 1516 Briar Run
- 1525 Briar Run
- 1421 Briar Run
- 1505 Augusta Rd