Estimated Value: $200,000 - $294,000
3
Beds
1
Bath
1,079
Sq Ft
$231/Sq Ft
Est. Value
About This Home
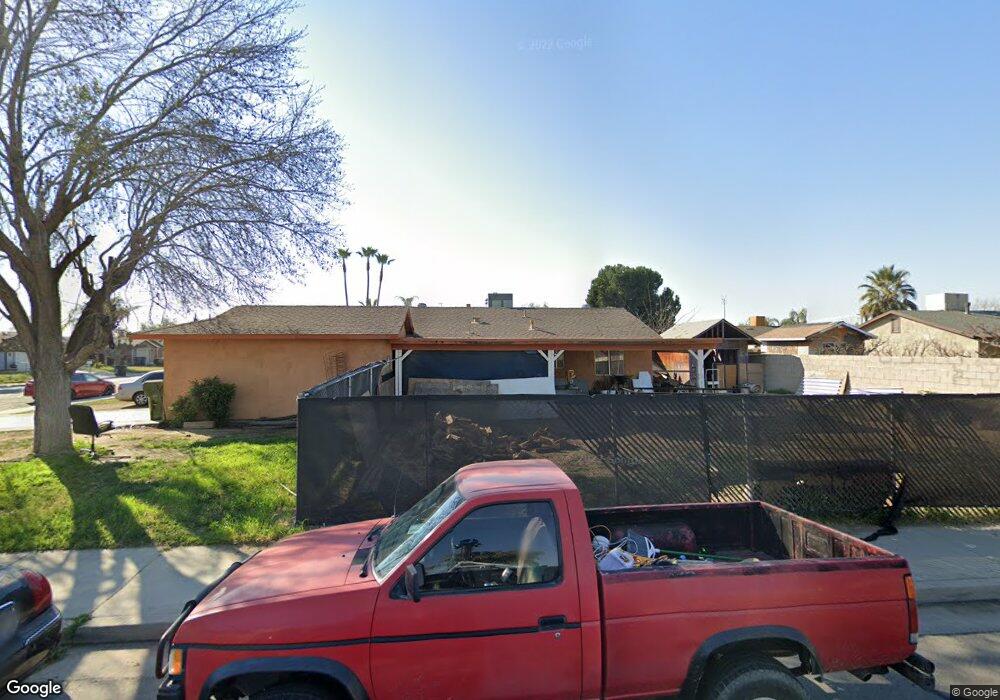
This home is located at 1509 Elm St, Wasco, CA 93280 and is currently estimated at $248,898, approximately $230 per square foot. 1509 Elm St is a home located in Kern County with nearby schools including Teresa Burke Elementary School, Thomas Jefferson Middle School, and Wasco High School.
Ownership History
Date
Name
Owned For
Owner Type
Purchase Details
Closed on
Dec 10, 2011
Sold by
Garcia Candido
Bought by
Garmed Investments Llc
Current Estimated Value
Purchase Details
Closed on
Jul 21, 2011
Sold by
Federal Home Loan Mortgage Corporation
Bought by
Garcia Candido
Purchase Details
Closed on
Mar 10, 2011
Sold by
Wells Fargo Bank Na
Bought by
Federal Home Loan Mortgage Corp
Purchase Details
Closed on
Mar 9, 2011
Sold by
Soria Gerardo Lira and Garcia Irasema
Bought by
Wells Fargo Bank Na
Purchase Details
Closed on
Apr 21, 2008
Sold by
Garcia Irasema
Bought by
Soria Gerardo Lira and Garcia Irasema
Home Financials for this Owner
Home Financials are based on the most recent Mortgage that was taken out on this home.
Original Mortgage
$109,000
Interest Rate
5.8%
Mortgage Type
New Conventional
Create a Home Valuation Report for This Property
The Home Valuation Report is an in-depth analysis detailing your home's value as well as a comparison with similar homes in the area
Home Values in the Area
Average Home Value in this Area
Purchase History
| Date | Buyer | Sale Price | Title Company |
|---|---|---|---|
| Garmed Investments Llc | -- | None Available | |
| Garcia Candido | $54,000 | Ticor Title | |
| Federal Home Loan Mortgage Corp | -- | None Available | |
| Wells Fargo Bank Na | $74,000 | None Available | |
| Soria Gerardo Lira | -- | Chicago Title Company |
Source: Public Records
Mortgage History
| Date | Status | Borrower | Loan Amount |
|---|---|---|---|
| Previous Owner | Soria Gerardo Lira | $109,000 |
Source: Public Records
Tax History Compared to Growth
Tax History
| Year | Tax Paid | Tax Assessment Tax Assessment Total Assessment is a certain percentage of the fair market value that is determined by local assessors to be the total taxable value of land and additions on the property. | Land | Improvement |
|---|---|---|---|---|
| 2025 | $1,150 | $77,866 | $18,837 | $59,029 |
| 2024 | $1,117 | $76,340 | $18,468 | $57,872 |
| 2023 | $1,117 | $74,844 | $18,106 | $56,738 |
| 2022 | $1,061 | $73,377 | $17,751 | $55,626 |
| 2021 | $1,028 | $71,939 | $17,403 | $54,536 |
| 2020 | $956 | $71,202 | $17,225 | $53,977 |
| 2019 | $950 | $71,202 | $17,225 | $53,977 |
| 2018 | $953 | $68,439 | $16,557 | $51,882 |
| 2017 | $929 | $67,098 | $16,233 | $50,865 |
| 2016 | $855 | $65,783 | $15,915 | $49,868 |
| 2015 | $829 | $64,795 | $15,676 | $49,119 |
| 2014 | $802 | $63,526 | $15,369 | $48,157 |
Source: Public Records
Map
Nearby Homes