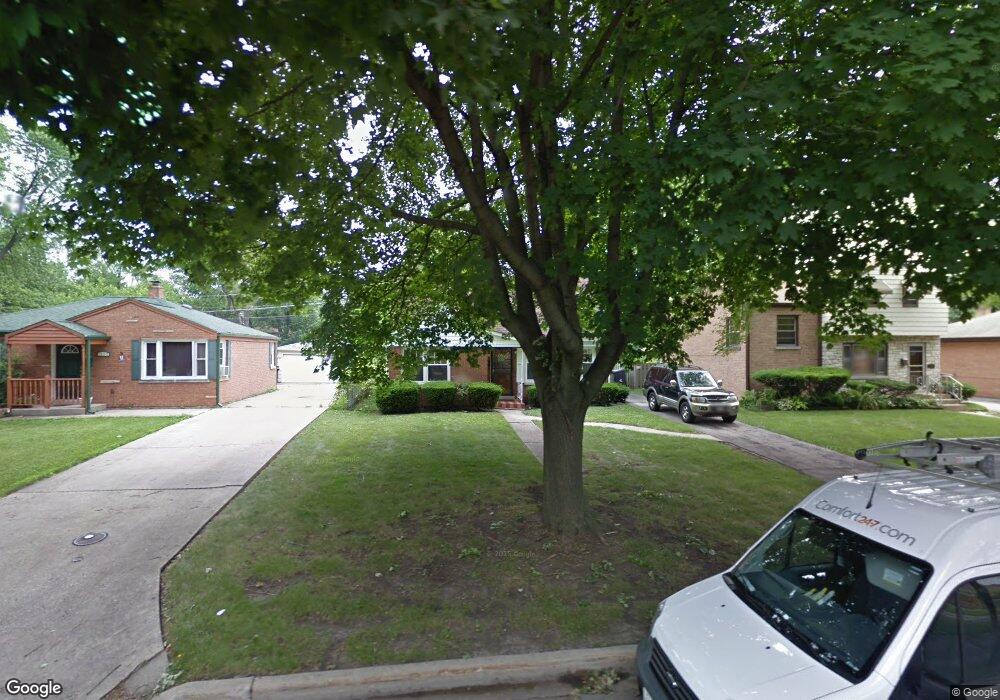
1509 N Rohde Ave Berkeley, IL 60163
Estimated Value: $275,968 - $310,000
3
Beds
1
Bath
1,230
Sq Ft
$241/Sq Ft
Est. Value
About This Home
This home is located at 1509 N Rohde Ave, Berkeley, IL 60163 and is currently estimated at $296,492, approximately $241 per square foot. 1509 N Rohde Ave is a home located in Cook County with nearby schools including Macarthur Intermediate School, Sunnyside Elementary School, and Proviso West High School.
Ownership History
Date
Name
Owned For
Owner Type
Purchase Details
Closed on
Dec 7, 2007
Sold by
Neal Kevin T and Neal Jacqueline R
Bought by
Neal Kevin T and Neal Jacqueline R
Current Estimated Value
Home Financials for this Owner
Home Financials are based on the most recent Mortgage that was taken out on this home.
Original Mortgage
$194,372
Outstanding Balance
$121,413
Interest Rate
6.31%
Mortgage Type
New Conventional
Estimated Equity
$175,079
Purchase Details
Closed on
May 4, 2007
Sold by
Neal Kevin T and Neal Jacqueline R
Bought by
Neal Kevin T and Neal Jacqueline R
Home Financials for this Owner
Home Financials are based on the most recent Mortgage that was taken out on this home.
Original Mortgage
$149,500
Interest Rate
6.99%
Mortgage Type
New Conventional
Purchase Details
Closed on
Jun 30, 1994
Sold by
Ross Melanie and Collo Edith Lyn
Bought by
Neal Kevin T and Jefferson Jacqueline R
Home Financials for this Owner
Home Financials are based on the most recent Mortgage that was taken out on this home.
Original Mortgage
$102,863
Interest Rate
8.61%
Mortgage Type
FHA
Create a Home Valuation Report for This Property
The Home Valuation Report is an in-depth analysis detailing your home's value as well as a comparison with similar homes in the area
Home Values in the Area
Average Home Value in this Area
Purchase History
| Date | Buyer | Sale Price | Title Company |
|---|---|---|---|
| Neal Kevin T | -- | Traditional Title Co Llc | |
| Neal Kevin T | -- | None Available | |
| Neal Kevin T | $103,500 | -- |
Source: Public Records
Mortgage History
| Date | Status | Borrower | Loan Amount |
|---|---|---|---|
| Open | Neal Kevin T | $194,372 | |
| Closed | Neal Kevin T | $149,500 | |
| Closed | Neal Kevin T | $102,863 |
Source: Public Records
Tax History
| Year | Tax Paid | Tax Assessment Tax Assessment Total Assessment is a certain percentage of the fair market value that is determined by local assessors to be the total taxable value of land and additions on the property. | Land | Improvement |
|---|---|---|---|---|
| 2025 | $6,729 | $21,001 | $3,988 | $17,013 |
| 2024 | $6,729 | $21,001 | $3,988 | $17,013 |
| 2023 | $6,582 | $21,001 | $3,988 | $17,013 |
| 2022 | $6,582 | $18,032 | $2,719 | $15,313 |
| 2021 | $6,596 | $18,031 | $2,718 | $15,313 |
| 2020 | $6,320 | $18,031 | $2,718 | $15,313 |
| 2019 | $5,282 | $15,563 | $2,537 | $13,026 |
| 2018 | $5,175 | $15,563 | $2,537 | $13,026 |
| 2017 | $4,965 | $15,563 | $2,537 | $13,026 |
| 2016 | $2,997 | $9,711 | $2,356 | $7,355 |
| 2015 | $2,931 | $9,711 | $2,356 | $7,355 |
| 2014 | $2,901 | $9,711 | $2,356 | $7,355 |
| 2013 | $4,481 | $14,573 | $2,356 | $12,217 |
Source: Public Records
Map
Nearby Homes
- 768 N Rohde Ave
- 1463 Speechley Blvd
- 512 50th Ave
- 4904 W Hawthorne Ave
- 241 48th Ave
- 605 N Wolf Rd Unit B9
- 129 49th Ave
- 4938 W Randolph St
- 51 50th Ave
- 4530 Butterfield Rd
- 1529 N Hillside Ave
- 520 N Wolf Rd Unit 203
- 4353 Butterfield Rd
- 33 49th Ave
- 47 48th Ave
- 429 Geneva Ave
- 31 46th Ave
- 443 Granville Ave
- 311 Buckthorn Ln
- 1447 N Ashbel Ave
- 1513 N Rohde Ave
- 1505 N Rohde Ave
- 1517 N Rohde Ave
- 1501 N Rohde Ave
- 1508 Speechley Blvd
- 1521 N Rohde Ave
- 1512 Speechley Blvd
- 1504 Speechley Blvd
- 1516 Speechley Blvd
- 1500 Speechley Blvd
- 1523 N Rohde Ave
- 1520 Speechley Blvd
- 1508 N Rohde Ave
- 1463 N Rohde Ave
- 1504 N Rohde Ave
- 1512 N Rohde Ave
- 1500 N Rohde Ave
- 1518 N Rohde Ave
- 1524 Speechley Blvd
- 1529 N Rohde Ave
Your Personal Tour Guide
Ask me questions while you tour the home.