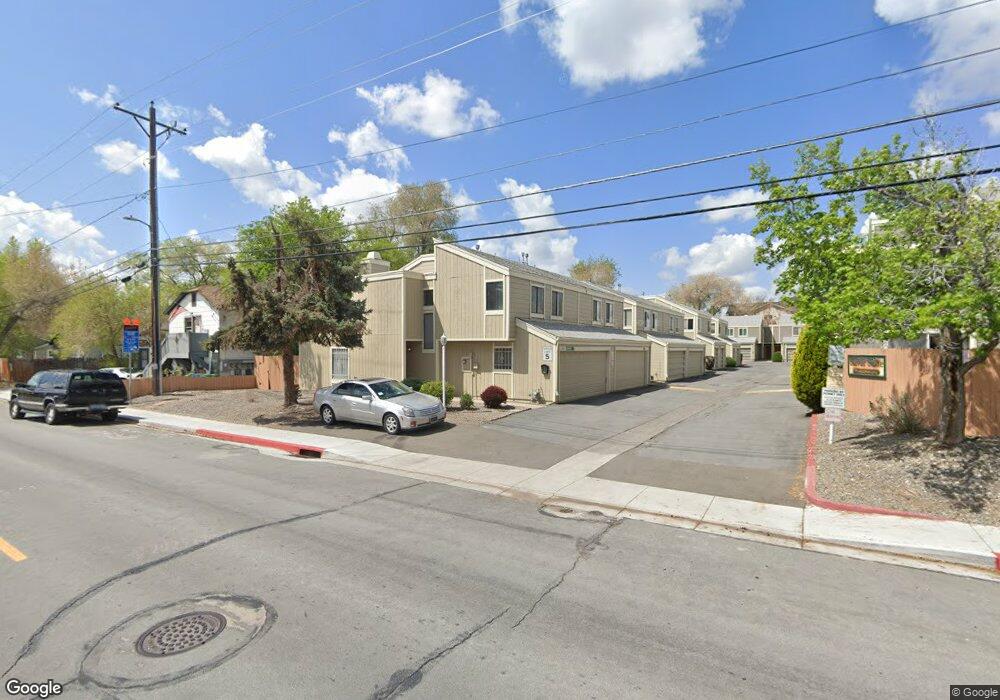
1509 Shannon Way Unit 1 Sparks, NV 89431
Downtown Sparks NeighborhoodEstimated Value: $215,000 - $294,272
3
Beds
2
Baths
1,370
Sq Ft
$195/Sq Ft
Est. Value
About This Home
This home is located at 1509 Shannon Way Unit 1, Sparks, NV 89431 and is currently estimated at $267,068, approximately $194 per square foot. 1509 Shannon Way Unit 1 is a home located in Washoe County with nearby schools including Robert Mitchell Elementary School, Sparks Middle School, and Sparks High School.
Ownership History
Date
Name
Owned For
Owner Type
Purchase Details
Closed on
Mar 5, 2013
Sold by
Thorpe Jeremy
Bought by
The Jeremy Thorpe Living Trust
Current Estimated Value
Purchase Details
Closed on
Nov 23, 2012
Sold by
Federal National Mortgage Association
Bought by
Thorpe Jeremy
Purchase Details
Closed on
Sep 1, 2012
Sold by
Ceccarelli Randolph and Ceccarelli Laura K
Bought by
Federal National Mortgage Association
Purchase Details
Closed on
Apr 27, 2010
Sold by
Ceccarelli Randolph and Ceccarelli Laura
Bought by
Chase and Chase Home Finance
Purchase Details
Closed on
Aug 31, 2007
Sold by
Hess Fred and Hess Deborah L
Bought by
Ceccarelli Randolph and Ceccarelli Laura K
Home Financials for this Owner
Home Financials are based on the most recent Mortgage that was taken out on this home.
Original Mortgage
$173,800
Interest Rate
6.74%
Mortgage Type
Unknown
Purchase Details
Closed on
Oct 20, 1994
Sold by
Bank Of America
Bought by
Hess Fred and Hess Deborah L
Create a Home Valuation Report for This Property
The Home Valuation Report is an in-depth analysis detailing your home's value as well as a comparison with similar homes in the area
Home Values in the Area
Average Home Value in this Area
Purchase History
| Date | Buyer | Sale Price | Title Company |
|---|---|---|---|
| The Jeremy Thorpe Living Trust | -- | None Available | |
| Thorpe Jeremy | $55,000 | Service Link Reo Title | |
| Federal National Mortgage Association | $164,654 | None Available | |
| Chase | $81,500 | None Available | |
| Ceccarelli Randolph | $183,000 | Capital Title Company | |
| Hess Fred | $6,000 | Stewart Title |
Source: Public Records
Mortgage History
| Date | Status | Borrower | Loan Amount |
|---|---|---|---|
| Previous Owner | Ceccarelli Randolph | $173,800 |
Source: Public Records
Tax History Compared to Growth
Tax History
| Year | Tax Paid | Tax Assessment Tax Assessment Total Assessment is a certain percentage of the fair market value that is determined by local assessors to be the total taxable value of land and additions on the property. | Land | Improvement |
|---|---|---|---|---|
| 2025 | $602 | $39,049 | $20,825 | $18,224 |
| 2024 | $585 | $40,385 | $21,070 | $19,315 |
| 2023 | $585 | $37,228 | $19,775 | $17,453 |
| 2022 | $568 | $30,798 | $15,400 | $15,398 |
| 2021 | $552 | $28,182 | $12,460 | $15,722 |
| 2020 | $534 | $28,842 | $12,705 | $16,137 |
| 2019 | $519 | $26,501 | $10,675 | $15,826 |
| 2018 | $503 | $23,139 | $7,350 | $15,789 |
| 2017 | $488 | $22,232 | $6,300 | $15,932 |
| 2016 | $477 | $21,102 | $4,830 | $16,272 |
| 2015 | $122 | $20,478 | $3,675 | $16,803 |
| 2014 | $458 | $16,940 | $2,660 | $14,280 |
| 2013 | -- | $12,181 | $1,820 | $10,361 |
Source: Public Records
Map
Nearby Homes
- 1509 Shannon Way
- 1505 Shannon Way
- 1515 Shannon Way
- 1519 Shannon Way Unit 54
- 956 Damon Place
- 915 15th St Unit 4
- 915 15th St
- 1521 Shannon Way
- 960 Damon Place
- 1525 Shannon Way
- 963 Damon Place Unit 49
- 967 Damon Ln
- 967 Damon Place
- 1529 Shannon Way
- 970 Damon Place
- 973 Damon Place
- 1533 Shannon Way
- 1520 I St
- 979 Damon Ln
- 979 Damon Place