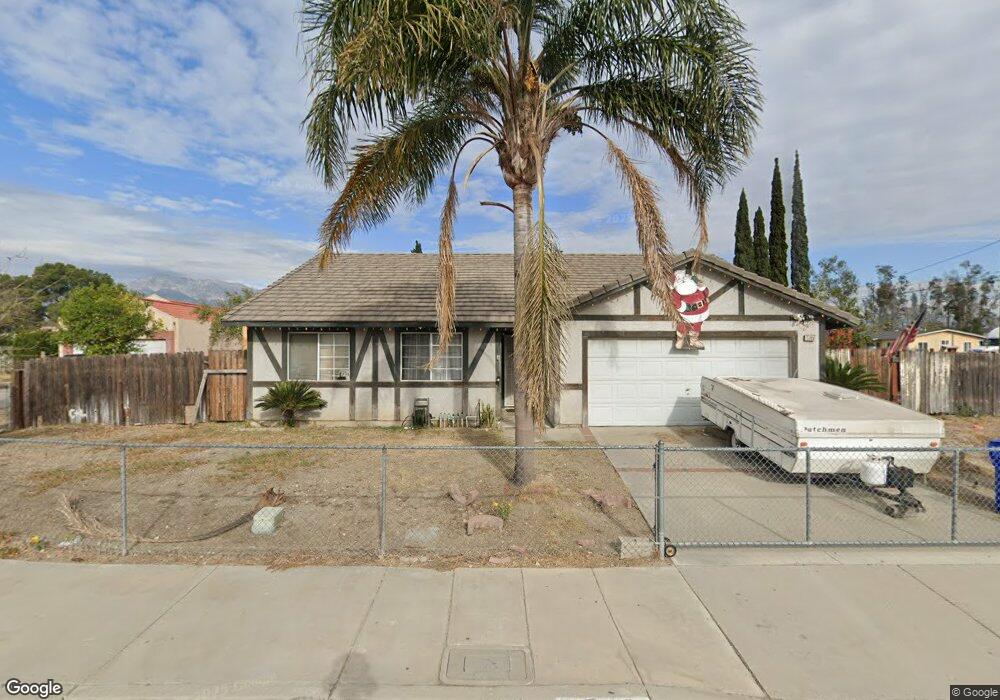
15098 Fontlee Ln Fontana, CA 92335
Estimated Value: $572,000 - $622,000
4
Beds
2
Baths
1,327
Sq Ft
$449/Sq Ft
Est. Value
About This Home
This home is located at 15098 Fontlee Ln, Fontana, CA 92335 and is currently estimated at $595,982, approximately $449 per square foot. 15098 Fontlee Ln is a home located in San Bernardino County with nearby schools including Live Oak Elementary School, Sequoia Middle School, and Henry J. Kaiser High School.
Ownership History
Date
Name
Owned For
Owner Type
Purchase Details
Closed on
Aug 9, 2005
Sold by
Soltis Olivia
Bought by
Soltis John P
Current Estimated Value
Home Financials for this Owner
Home Financials are based on the most recent Mortgage that was taken out on this home.
Original Mortgage
$210,000
Outstanding Balance
$110,599
Interest Rate
5.7%
Mortgage Type
New Conventional
Estimated Equity
$485,383
Purchase Details
Closed on
Jul 25, 2003
Sold by
Soltis John P
Bought by
Soltis John P and Soltis Olivia
Purchase Details
Closed on
May 17, 2002
Sold by
Soltis Olivia
Bought by
Soltis John P
Home Financials for this Owner
Home Financials are based on the most recent Mortgage that was taken out on this home.
Original Mortgage
$116,250
Interest Rate
6.94%
Create a Home Valuation Report for This Property
The Home Valuation Report is an in-depth analysis detailing your home's value as well as a comparison with similar homes in the area
Home Values in the Area
Average Home Value in this Area
Purchase History
| Date | Buyer | Sale Price | Title Company |
|---|---|---|---|
| Soltis John P | -- | Old Republic Title Glendale | |
| Soltis John P | -- | -- | |
| Soltis John P | -- | American Title Co |
Source: Public Records
Mortgage History
| Date | Status | Borrower | Loan Amount |
|---|---|---|---|
| Open | Soltis John P | $210,000 | |
| Closed | Soltis John P | $116,250 |
Source: Public Records
Tax History Compared to Growth
Tax History
| Year | Tax Paid | Tax Assessment Tax Assessment Total Assessment is a certain percentage of the fair market value that is determined by local assessors to be the total taxable value of land and additions on the property. | Land | Improvement |
|---|---|---|---|---|
| 2025 | $2,273 | $224,943 | $56,169 | $168,774 |
| 2024 | $2,273 | $220,533 | $55,068 | $165,465 |
| 2023 | $2,213 | $216,209 | $53,988 | $162,221 |
| 2022 | $2,203 | $211,969 | $52,929 | $159,040 |
| 2021 | $2,174 | $207,813 | $51,891 | $155,922 |
| 2020 | $2,168 | $205,682 | $51,359 | $154,323 |
| 2019 | $2,100 | $201,649 | $50,352 | $151,297 |
| 2018 | $2,131 | $197,695 | $49,365 | $148,330 |
| 2017 | $2,118 | $193,819 | $48,397 | $145,422 |
| 2016 | $2,081 | $190,019 | $47,448 | $142,571 |
| 2015 | $2,053 | $187,164 | $46,735 | $140,429 |
| 2014 | $2,048 | $183,498 | $45,820 | $137,678 |
Source: Public Records
Map
Nearby Homes
- 15141 Randall Ave
- 9310 Carob St
- 9226 Cattail Ln
- 14989 Hibiscus Ave
- 9153 Beech Ave
- 15317 Athol St
- 15413 Pine Ave
- 9059 Beech Ave
- 9828 Carob Ave
- 15589 Randall Ave
- 10238 Cherry Ave
- 9756 Elm Ave
- 9408 Poplar Ave
- 14582 El Molino St
- 15867 Randall Ave
- 14718 Valencia Ave
- 14708 Valencia Ave
- 9963 Eugenia Ave
- 15937 Manzanita Dr
- 9833 Niagara Ave
- 9350 Hemlock Ave
- 15086 Fontlee Ln
- 9378 Hemlock Ave
- 15074 Fontlee Ln
- 9330 Hemlock Ave
- 15062 Fontlee Ln
- 9355 Hemlock Ave
- 15087 Fontlee Ln
- 9381 Hemlock Ave
- 15063 Fontlee Ln
- 9392 Hemlock Ave
- 9343 Hemlock Ave
- 9337 Hemlock Ave
- 15075 Fontlee Ln
- 9302 Hemlock Ave
- 9393 Hemlock Ave
- 9327 Hemlock Ave
- 15055 Randall Ave
- 15081 Randall Ave
- 9349 Morning Glory Place