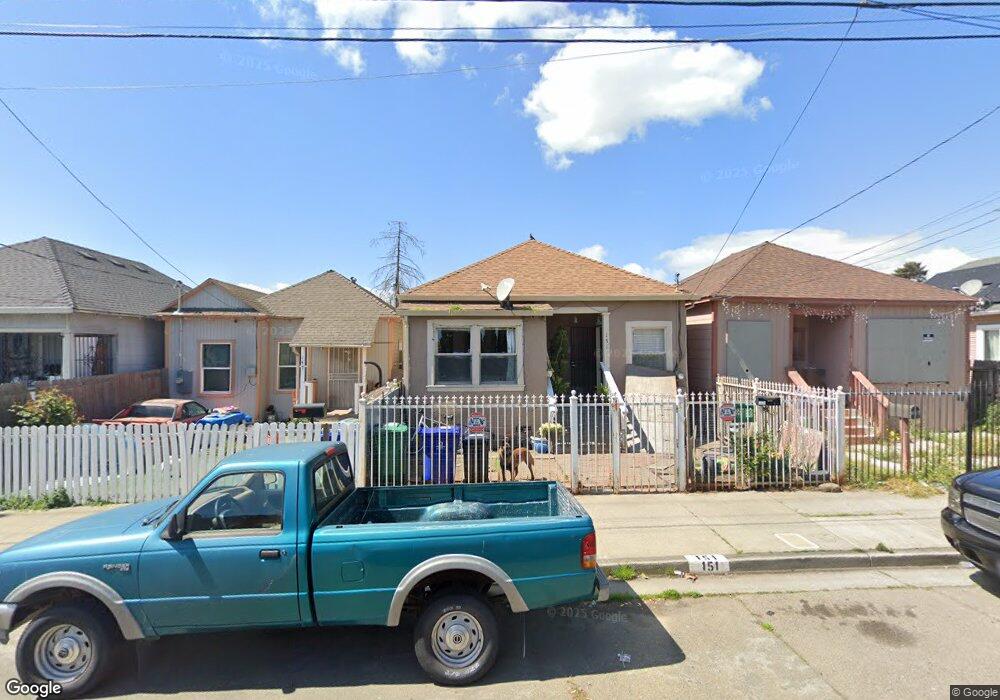
151 4th St Richmond, CA 94801
Iron Triangle NeighborhoodEstimated Value: $354,000 - $499,000
3
Beds
2
Baths
998
Sq Ft
$443/Sq Ft
Est. Value
About This Home
This home is located at 151 4th St, Richmond, CA 94801 and is currently estimated at $441,956, approximately $442 per square foot. 151 4th St is a home located in Contra Costa County with nearby schools including Lincoln Elementary School, Lovonya DeJean Middle School, and John F. Kennedy High School.
Ownership History
Date
Name
Owned For
Owner Type
Purchase Details
Closed on
Aug 10, 2012
Sold by
Reconveyance National Trust Corporation
Bought by
Dallin Llc
Current Estimated Value
Purchase Details
Closed on
Sep 20, 2011
Sold by
Wells Fargo Bank National Association
Bought by
Chi Yeeling and Li Fusheng
Purchase Details
Closed on
Aug 30, 2010
Sold by
Ofoegbu Collins A and Ofoegbu Nnenna V
Bought by
Reconveyance National Trust Corporation
Home Financials for this Owner
Home Financials are based on the most recent Mortgage that was taken out on this home.
Original Mortgage
$60,700
Interest Rate
4.51%
Mortgage Type
Unknown
Purchase Details
Closed on
Jun 20, 2008
Sold by
Ofoegbu Collins A and Ofoegbu Nnenna V
Bought by
Premier Investments Lp
Purchase Details
Closed on
Jul 5, 1994
Sold by
Parent Robert H
Bought by
Wells Porter L
Home Financials for this Owner
Home Financials are based on the most recent Mortgage that was taken out on this home.
Original Mortgage
$15,500
Interest Rate
8.65%
Mortgage Type
Purchase Money Mortgage
Purchase Details
Closed on
Jun 17, 1994
Sold by
Beattie David
Bought by
Beattie Ruby Lucille
Home Financials for this Owner
Home Financials are based on the most recent Mortgage that was taken out on this home.
Original Mortgage
$15,500
Interest Rate
8.65%
Mortgage Type
Purchase Money Mortgage
Purchase Details
Closed on
Jun 14, 1994
Sold by
Fischer Shirley
Bought by
Ofoegbu Collins A and Ofoegbu Nnenna
Home Financials for this Owner
Home Financials are based on the most recent Mortgage that was taken out on this home.
Original Mortgage
$15,500
Interest Rate
8.65%
Mortgage Type
Purchase Money Mortgage
Create a Home Valuation Report for This Property
The Home Valuation Report is an in-depth analysis detailing your home's value as well as a comparison with similar homes in the area
Home Values in the Area
Average Home Value in this Area
Purchase History
| Date | Buyer | Sale Price | Title Company |
|---|---|---|---|
| Dallin Llc | $76,000 | Placer Title Company | |
| Chi Yeeling | $178,000 | Ticor Title Company Of Ca | |
| Reconveyance National Trust Corporation | $50,700 | Old Republic Title | |
| Premier Investments Lp | -- | None Available | |
| Wells Porter L | -- | -- | |
| Beattie Ruby Lucille | -- | Old Republic Title Company | |
| Ofoegbu Collins A | $2,500 | Old Republic Title Company | |
| Ofoegbu Collins A | $2,500 | Old Republic Title Company | |
| Ofoegbu Collins A | $2,500 | Old Republic Title Company | |
| Ofoegbu Collins A | $2,500 | Old Republic Title Company | |
| Ofoegbu Collins A | $2,500 | Old Republic Title Company | |
| Ofoegbu Collins A | $2,500 | Old Republic Title Company | |
| Ofoegbu Collins A | $2,500 | Old Republic Title Company |
Source: Public Records
Mortgage History
| Date | Status | Borrower | Loan Amount |
|---|---|---|---|
| Previous Owner | Reconveyance National Trust Corporation | $60,700 | |
| Previous Owner | Ofoegbu Collins A | $15,500 |
Source: Public Records
Tax History
| Year | Tax Paid | Tax Assessment Tax Assessment Total Assessment is a certain percentage of the fair market value that is determined by local assessors to be the total taxable value of land and additions on the property. | Land | Improvement |
|---|---|---|---|---|
| 2025 | $5,944 | $312,899 | $261,699 | $51,200 |
| 2024 | $5,758 | $306,765 | $256,568 | $50,197 |
| 2023 | $5,758 | $300,751 | $251,538 | $49,213 |
| 2022 | $5,722 | $300,749 | $251,537 | $49,212 |
| 2021 | $5,649 | $294,853 | $246,605 | $48,248 |
| 2019 | $5,304 | $286,110 | $239,292 | $46,818 |
| 2018 | $5,115 | $280,500 | $234,600 | $45,900 |
| 2017 | $2,245 | $79,045 | $15,915 | $63,130 |
| 2016 | $2,180 | $77,496 | $15,603 | $61,893 |
| 2015 | $2,137 | $76,333 | $15,369 | $60,964 |
| 2014 | $2,126 | $74,838 | $15,068 | $59,770 |
Source: Public Records
Map
Nearby Homes
Your Personal Tour Guide
Ask me questions while you tour the home.