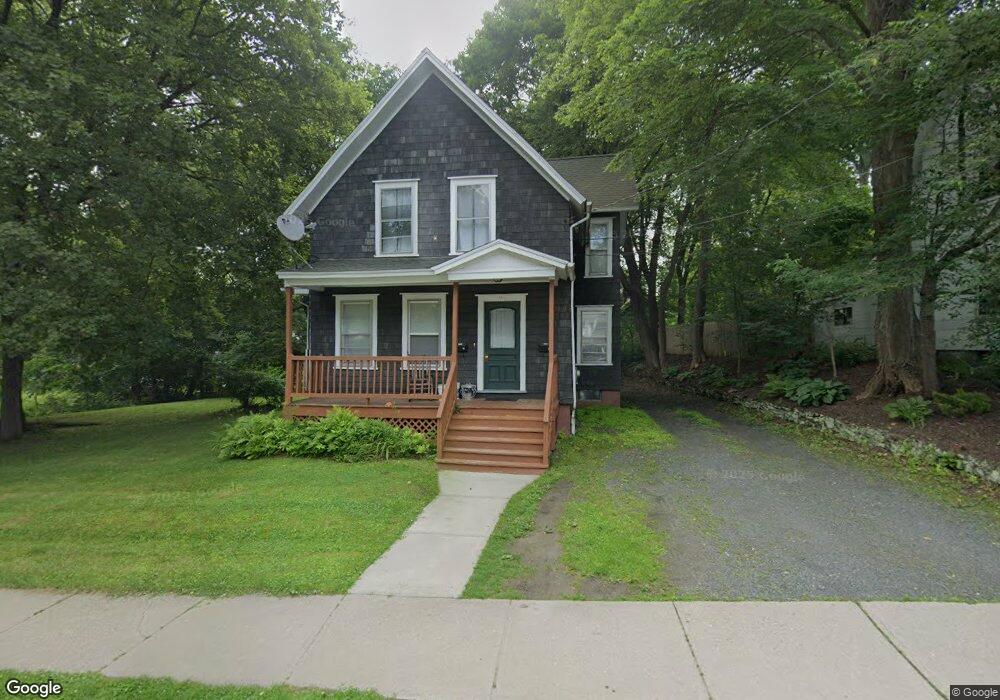
151 Davis St Greenfield, MA 01301
Estimated Value: $278,000 - $342,957
3
Beds
2
Baths
1,914
Sq Ft
$161/Sq Ft
Est. Value
About This Home
This home is located at 151 Davis St, Greenfield, MA 01301 and is currently estimated at $307,989, approximately $160 per square foot. 151 Davis St is a home located in Franklin County with nearby schools including Cornerstone Christian School and Holy Trinity School.
Ownership History
Date
Name
Owned For
Owner Type
Purchase Details
Closed on
Jun 1, 2022
Sold by
Zaccheo Mark A
Bought by
Olive Street Dev Llc
Current Estimated Value
Purchase Details
Closed on
Jul 22, 2004
Sold by
Derusha Edward R and Derusha Allison R
Bought by
Zaccheo Mark A and Zaccheo Barbara N
Purchase Details
Closed on
Feb 18, 1994
Sold by
Herrmann Paul
Bought by
Derusha Edward R and Derusha Allison R
Home Financials for this Owner
Home Financials are based on the most recent Mortgage that was taken out on this home.
Original Mortgage
$84,000
Interest Rate
7.18%
Mortgage Type
Purchase Money Mortgage
Purchase Details
Closed on
Mar 12, 1990
Sold by
Gallagher James J
Bought by
Herrmann Paul
Create a Home Valuation Report for This Property
The Home Valuation Report is an in-depth analysis detailing your home's value as well as a comparison with similar homes in the area
Home Values in the Area
Average Home Value in this Area
Purchase History
| Date | Buyer | Sale Price | Title Company |
|---|---|---|---|
| Olive Street Dev Llc | -- | None Available | |
| Olive Street Dev Llc | -- | None Available | |
| Spencer Mark S | -- | None Available | |
| Spencer Mark S | -- | None Available | |
| Zaccheo Mark A | $150,000 | -- | |
| Zaccheo Mark A | $150,000 | -- | |
| Derusha Edward R | $88,500 | -- | |
| Derusha Edward R | $88,500 | -- | |
| Herrmann Paul | $63,000 | -- | |
| Herrmann Paul | $63,000 | -- |
Source: Public Records
Mortgage History
| Date | Status | Borrower | Loan Amount |
|---|---|---|---|
| Previous Owner | Herrmann Paul | $170,966 | |
| Previous Owner | Herrmann Paul | $85,400 | |
| Previous Owner | Herrmann Paul | $84,000 |
Source: Public Records
Tax History Compared to Growth
Tax History
| Year | Tax Paid | Tax Assessment Tax Assessment Total Assessment is a certain percentage of the fair market value that is determined by local assessors to be the total taxable value of land and additions on the property. | Land | Improvement |
|---|---|---|---|---|
| 2025 | $5,463 | $279,300 | $65,400 | $213,900 |
| 2024 | $5,395 | $264,600 | $52,400 | $212,200 |
| 2023 | $4,677 | $238,000 | $52,400 | $185,600 |
| 2022 | $4,361 | $195,400 | $47,500 | $147,900 |
| 2021 | $4,275 | $184,100 | $47,100 | $137,000 |
| 2020 | $4,125 | $179,900 | $42,900 | $137,000 |
| 2019 | $3,897 | $174,300 | $37,300 | $137,000 |
| 2018 | $3,824 | $170,500 | $36,600 | $133,900 |
| 2017 | $3,705 | $170,500 | $36,600 | $133,900 |
| 2016 | $3,788 | $173,700 | $35,200 | $138,500 |
| 2015 | $3,721 | $165,300 | $39,400 | $125,900 |
| 2014 | $3,394 | $165,300 | $39,400 | $125,900 |
Source: Public Records
Map
Nearby Homes
- 144 1/2 School St
- 144 School St Unit 146
- 144-1/2 School St
- 147 Davis St
- 159 Davis St
- 142 School St
- 163 Davis St
- 150 School St Unit 154
- 150 Davis St
- 156 School St
- 146 Davis St
- 158 Davis St
- 165 Davis St
- 144 Davis St
- 147 School St Unit 149
- 167 Davis St Unit 169
- 158 School St Unit 160
- 27 Leonard St
- 162-164 Davis St
- 19 Oak St