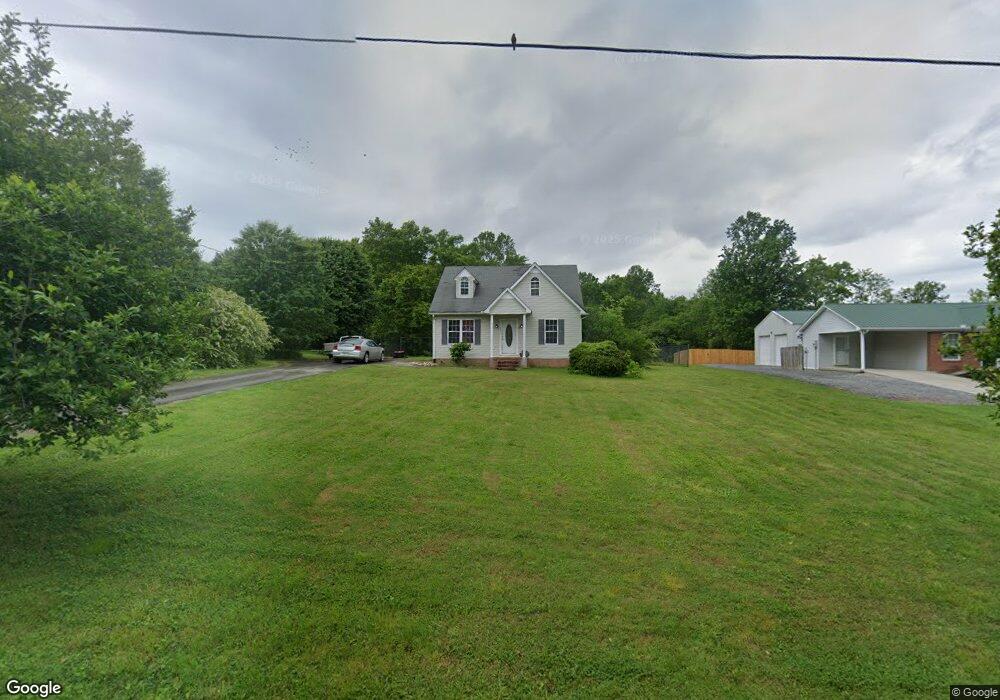
151 Dyer Ridge Rd Baxter, TN 38544
Estimated Value: $232,000 - $491,000
3
Beds
2
Baths
1,890
Sq Ft
$179/Sq Ft
Est. Value
About This Home
This home is located at 151 Dyer Ridge Rd, Baxter, TN 38544 and is currently estimated at $337,923, approximately $178 per square foot. 151 Dyer Ridge Rd is a home located in Putnam County with nearby schools including Baxter Primary School, Cornerstone Elementary School, and Upperman Middle School.
Ownership History
Date
Name
Owned For
Owner Type
Purchase Details
Closed on
Dec 23, 2024
Sold by
Tayes Jeremy and Tayes Crystal
Bought by
Siebert Teresa Louise and Siebert Pete W
Current Estimated Value
Purchase Details
Closed on
Apr 30, 2010
Sold by
Citifinancial Inc
Bought by
Denny W Leo
Purchase Details
Closed on
Mar 25, 2010
Sold by
Maxwell Angela M
Bought by
Citifinancial Inc
Purchase Details
Closed on
Jul 25, 2005
Sold by
Development Opportunities
Bought by
Maxwell Angela M
Home Financials for this Owner
Home Financials are based on the most recent Mortgage that was taken out on this home.
Original Mortgage
$70,000
Interest Rate
6.13%
Purchase Details
Closed on
Dec 3, 2003
Sold by
Jimmie Thomas
Bought by
Advocacy & Resources Corp
Purchase Details
Closed on
Nov 24, 2003
Sold by
Bryant Fred C and Bryant Mary
Bought by
Jimmie Thomas
Purchase Details
Closed on
May 25, 1942
Bought by
Thomas Jimmie
Create a Home Valuation Report for This Property
The Home Valuation Report is an in-depth analysis detailing your home's value as well as a comparison with similar homes in the area
Home Values in the Area
Average Home Value in this Area
Purchase History
| Date | Buyer | Sale Price | Title Company |
|---|---|---|---|
| Siebert Teresa Louise | $538,000 | Encore Title | |
| Denny W Leo | $47,500 | -- | |
| Citifinancial Inc | $64,500 | -- | |
| Maxwell Angela M | $87,500 | -- | |
| Advocacy & Resources Corp | $49,905 | -- | |
| Jimmie Thomas | $45,000 | -- | |
| Thomas Jimmie | -- | -- |
Source: Public Records
Mortgage History
| Date | Status | Borrower | Loan Amount |
|---|---|---|---|
| Previous Owner | Thomas Jimmie | $70,000 | |
| Previous Owner | Thomas Jimmie | $17,500 |
Source: Public Records
Tax History Compared to Growth
Tax History
| Year | Tax Paid | Tax Assessment Tax Assessment Total Assessment is a certain percentage of the fair market value that is determined by local assessors to be the total taxable value of land and additions on the property. | Land | Improvement |
|---|---|---|---|---|
| 2024 | $961 | $36,125 | $3,000 | $33,125 |
| 2023 | $961 | $36,125 | $3,000 | $33,125 |
| 2022 | $893 | $36,125 | $3,000 | $33,125 |
| 2021 | $1,286 | $36,125 | $3,000 | $33,125 |
| 2020 | $1,003 | $36,150 | $3,000 | $33,150 |
| 2019 | $1,003 | $23,225 | $3,000 | $20,225 |
| 2018 | $957 | $23,225 | $3,000 | $20,225 |
| 2017 | $957 | $23,225 | $3,000 | $20,225 |
| 2016 | $957 | $23,225 | $3,000 | $20,225 |
| 2015 | $1,009 | $23,225 | $3,000 | $20,225 |
| 2014 | $996 | $22,928 | $0 | $0 |
Source: Public Records
Map
Nearby Homes
- 133 Dyer Ridge Rd
- 169 Dyer Ridge Rd
- 125 Dyer Ridge Rd
- Lot 7 Dyer Ridge Rd
- 115 Dyer Ridge Rd
- 00 Dyer Ridge Rd
- 8350 Nashville Hwy
- 8370 Nashville Hwy
- 8388 Nashville Hwy
- 8406 Nashville Hwy
- 8294 Nashville Hwy
- 129 Thompson Ridge Rd
- 129 Thompson Ridge Rd
- 165 Thompson Ridge Rd
- 8269 Nashville Hwy
- 322 Dyer Ridge Rd
- 245 Thompson Ridge Rd
- 220B Birdwell Ln
- 8525 Nashville Hwy
- 440 Dyer Ridge Rd