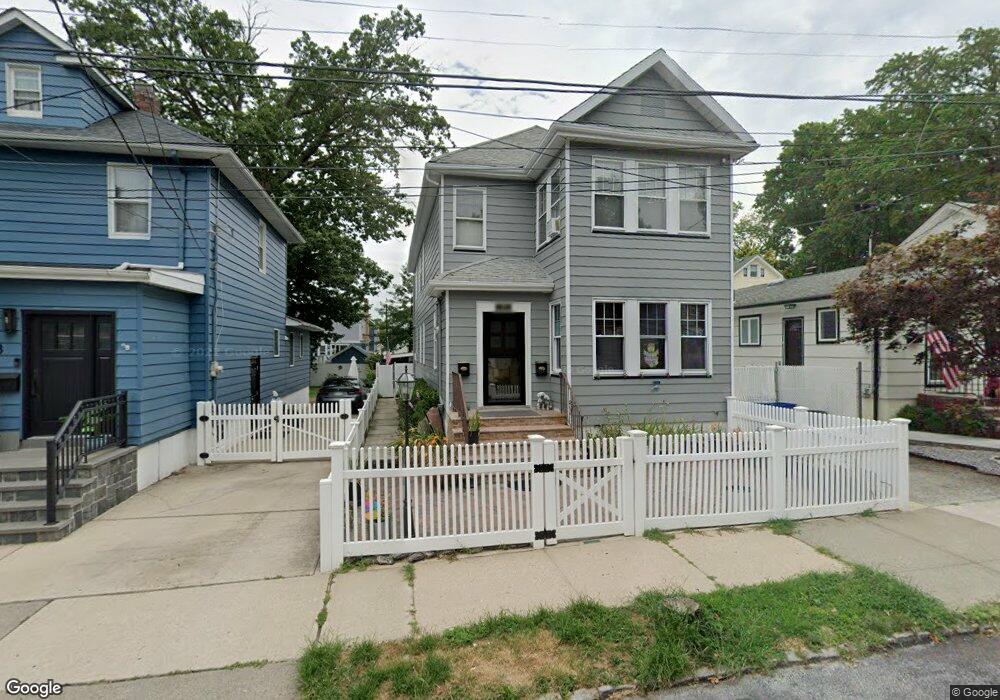
151 Garrison Ave Staten Island, NY 10314
Westerleigh NeighborhoodEstimated Value: $786,331 - $902,000
--
Bed
--
Bath
2,016
Sq Ft
$426/Sq Ft
Est. Value
About This Home
This home is located at 151 Garrison Ave, Staten Island, NY 10314 and is currently estimated at $858,333, approximately $425 per square foot. 151 Garrison Ave is a home located in Richmond County with nearby schools including P.S. 30 Westerleigh, I.S. 51 Edwin Markham, and Port Richmond High School.
Ownership History
Date
Name
Owned For
Owner Type
Purchase Details
Closed on
Jan 13, 2018
Sold by
Rinaldi Kenneth and Rinaldi Elizabeth
Bought by
Rinaldi Michael and Rinaldi Noreen
Current Estimated Value
Home Financials for this Owner
Home Financials are based on the most recent Mortgage that was taken out on this home.
Original Mortgage
$268,053
Outstanding Balance
$226,147
Interest Rate
3.93%
Mortgage Type
New Conventional
Estimated Equity
$632,186
Purchase Details
Closed on
Dec 16, 2004
Sold by
Glauner Barbara and Rainkie Bruce
Bought by
Rinaldi Kenneth and Rinaldi Elizabeth
Home Financials for this Owner
Home Financials are based on the most recent Mortgage that was taken out on this home.
Original Mortgage
$360,000
Interest Rate
4.5%
Mortgage Type
Fannie Mae Freddie Mac
Purchase Details
Closed on
Nov 29, 2003
Sold by
Klugewicz Helen
Bought by
Glauner Barbara and Rainkie Bruce
Create a Home Valuation Report for This Property
The Home Valuation Report is an in-depth analysis detailing your home's value as well as a comparison with similar homes in the area
Home Values in the Area
Average Home Value in this Area
Purchase History
| Date | Buyer | Sale Price | Title Company |
|---|---|---|---|
| Rinaldi Michael | $255,497 | Thoroughbred Title Services | |
| Rinaldi Kenneth | $450,000 | United General Title Ins Co | |
| Glauner Barbara | -- | -- |
Source: Public Records
Mortgage History
| Date | Status | Borrower | Loan Amount |
|---|---|---|---|
| Open | Rinaldi Michael | $268,053 | |
| Previous Owner | Rinaldi Kenneth | $360,000 |
Source: Public Records
Tax History Compared to Growth
Tax History
| Year | Tax Paid | Tax Assessment Tax Assessment Total Assessment is a certain percentage of the fair market value that is determined by local assessors to be the total taxable value of land and additions on the property. | Land | Improvement |
|---|---|---|---|---|
| 2025 | $7,876 | $49,260 | $12,505 | $36,755 |
| 2024 | $7,876 | $46,440 | $12,514 | $33,926 |
| 2023 | $7,519 | $37,025 | $10,128 | $26,897 |
| 2022 | $7,391 | $45,180 | $14,820 | $30,360 |
| 2021 | $7,394 | $42,240 | $14,820 | $27,420 |
| 2020 | $7,332 | $41,340 | $14,820 | $26,520 |
| 2019 | $6,836 | $44,880 | $14,820 | $30,060 |
| 2018 | $5,992 | $30,854 | $12,638 | $18,216 |
| 2017 | $5,990 | $30,854 | $13,300 | $17,554 |
| 2016 | $5,543 | $29,280 | $14,820 | $14,460 |
| 2015 | $4,921 | $28,865 | $15,239 | $13,626 |
| 2014 | $4,921 | $27,232 | $15,043 | $12,189 |
Source: Public Records
Map
Nearby Homes
- 116 Bidwell Ave
- 184 Dickie Ave
- 212 Demorest Ave
- 151 Clinton B Fisk Ave
- 153 Clinton B Fisk Ave
- 262 Maine Ave
- 159 North Ave
- 32 Dickie Ave
- 349 College Ave
- 36 Shaw Place
- 60 North Ave
- 325 College Ave
- 40 North Ave
- 615 Jewett Ave
- 78 Burnside Ave
- 304 Kingsley Ave
- 279 Saint John Ave
- 75 Muller Ave
- 751 Jewett Ave Unit 17
- 751 Jewett Ave
- 153 Garrison Ave
- 145 Garrison Ave
- 142 Neal Dow Ave
- 157 Garrison Ave
- 141 Garrison Ave
- 348 Maine Ave
- 159 Garrison Ave
- 344 Maine Ave
- 352 Maine Ave
- 144 Garrison Ave
- 152 Garrison Ave
- 340 Maine Ave
- 356 Maine Ave
- 156 Garrison Ave Unit 158
- 156-158 Garrison Ave
- 161 Garrison Ave
- 360 Maine Ave
- 160 Garrison Ave
- 158 Neal Dow Ave
- 364 Maine Ave