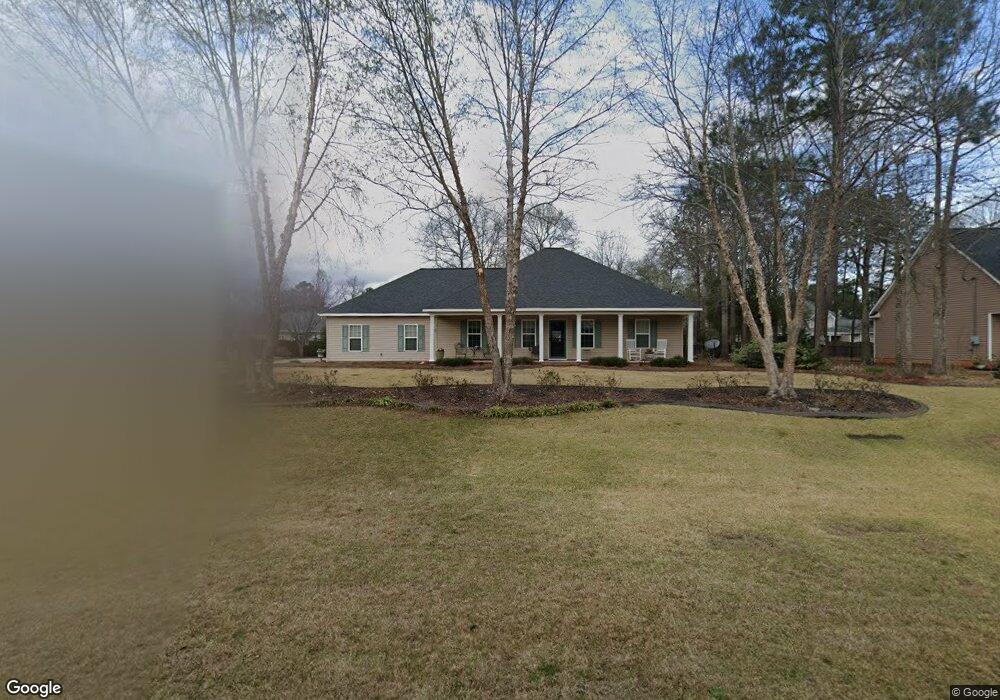
151 Lew Dr Macon, GA 31216
Estimated Value: $263,000 - $276,000
3
Beds
2
Baths
1,796
Sq Ft
$149/Sq Ft
Est. Value
About This Home
This home is located at 151 Lew Dr, Macon, GA 31216 and is currently estimated at $266,839, approximately $148 per square foot. 151 Lew Dr is a home located in Bibb County with nearby schools including Heard Elementary School, Rutland Middle School, and Rutland High School.
Ownership History
Date
Name
Owned For
Owner Type
Purchase Details
Closed on
Jan 17, 2006
Sold by
Ddg Co Llc
Bought by
Chambers Edward Royce and Chambers Barbara Jean
Current Estimated Value
Home Financials for this Owner
Home Financials are based on the most recent Mortgage that was taken out on this home.
Original Mortgage
$100,000
Interest Rate
6.21%
Mortgage Type
New Conventional
Purchase Details
Closed on
Sep 2, 2005
Create a Home Valuation Report for This Property
The Home Valuation Report is an in-depth analysis detailing your home's value as well as a comparison with similar homes in the area
Home Values in the Area
Average Home Value in this Area
Purchase History
| Date | Buyer | Sale Price | Title Company |
|---|---|---|---|
| Chambers Edward Royce | $155,480 | None Avilebel | |
| -- | $26,900 | -- |
Source: Public Records
Mortgage History
| Date | Status | Borrower | Loan Amount |
|---|---|---|---|
| Closed | Chambers Edward Royce | $100,000 |
Source: Public Records
Tax History Compared to Growth
Tax History
| Year | Tax Paid | Tax Assessment Tax Assessment Total Assessment is a certain percentage of the fair market value that is determined by local assessors to be the total taxable value of land and additions on the property. | Land | Improvement |
|---|---|---|---|---|
| 2025 | $2,122 | $100,934 | $7,360 | $93,574 |
| 2024 | $2,068 | $95,905 | $7,360 | $88,545 |
| 2023 | $1,814 | $75,638 | $7,360 | $68,278 |
| 2022 | $2,300 | $80,345 | $9,200 | $71,145 |
| 2021 | $2,147 | $70,354 | $9,200 | $61,154 |
| 2020 | $1,894 | $62,638 | $7,360 | $55,278 |
| 2019 | $1,793 | $59,700 | $7,360 | $52,340 |
| 2018 | $2,926 | $59,700 | $7,360 | $52,340 |
| 2017 | $1,486 | $53,823 | $7,360 | $46,463 |
| 2016 | $1,603 | $53,328 | $7,360 | $45,968 |
| 2015 | $2,269 | $53,328 | $7,360 | $45,968 |
| 2014 | $2,273 | $53,328 | $7,360 | $45,968 |
Source: Public Records
Map
Nearby Homes