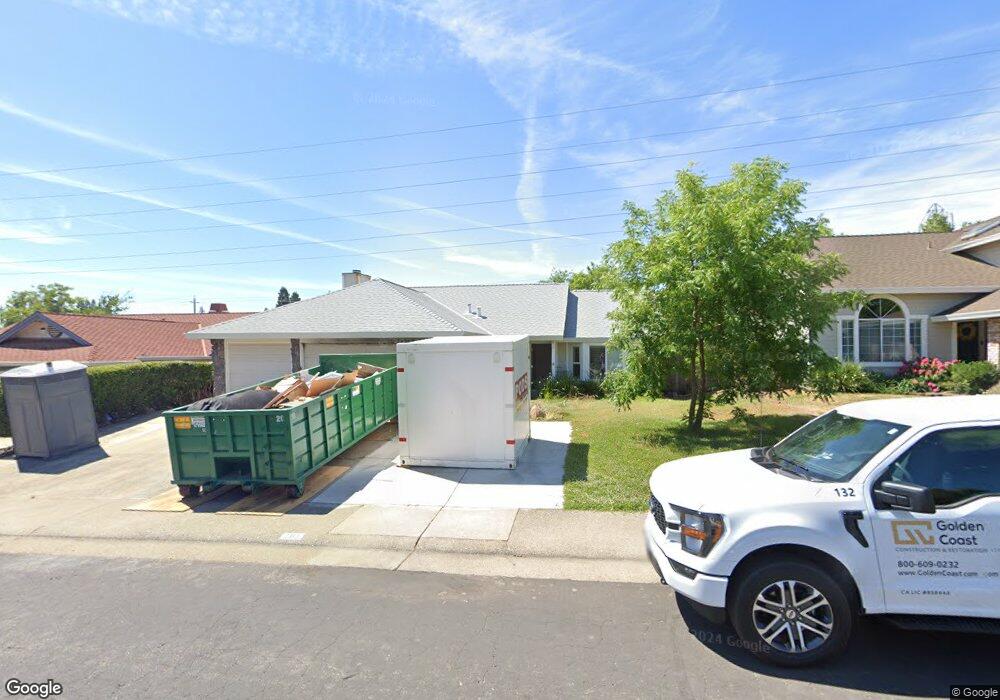
151 Livermore Way Folsom, CA 95630
Briggs Ranch NeighborhoodEstimated Value: $407,000 - $679,000
3
Beds
2
Baths
1,472
Sq Ft
$396/Sq Ft
Est. Value
About This Home
This home is located at 151 Livermore Way, Folsom, CA 95630 and is currently estimated at $582,287, approximately $395 per square foot. 151 Livermore Way is a home located in Sacramento County with nearby schools including Folsom Hills Elementary School, Folsom Middle School, and Vista Del Lago High School.
Ownership History
Date
Name
Owned For
Owner Type
Purchase Details
Closed on
Jul 28, 2022
Sold by
Michael Fanning Vernon
Bought by
Fanning Living Trust
Current Estimated Value
Purchase Details
Closed on
Sep 2, 2010
Sold by
Fanning Vernon Michael and Jayne Bobbie
Bought by
Fanning Vernon Michael
Home Financials for this Owner
Home Financials are based on the most recent Mortgage that was taken out on this home.
Original Mortgage
$291,700
Interest Rate
4.48%
Mortgage Type
New Conventional
Purchase Details
Closed on
Feb 19, 2005
Sold by
Hamerton Amy Z and Zajac Amy
Bought by
Lenci Sharyn
Home Financials for this Owner
Home Financials are based on the most recent Mortgage that was taken out on this home.
Original Mortgage
$309,950
Interest Rate
5%
Mortgage Type
Purchase Money Mortgage
Purchase Details
Closed on
Mar 31, 2004
Sold by
Fanning Vernon Michael
Bought by
Fanning Vernon Michael and Jayne Bobbi
Purchase Details
Closed on
Dec 11, 2001
Sold by
Fanning Shelley Marie
Bought by
Fanning Vernon Michael
Create a Home Valuation Report for This Property
The Home Valuation Report is an in-depth analysis detailing your home's value as well as a comparison with similar homes in the area
Home Values in the Area
Average Home Value in this Area
Purchase History
| Date | Buyer | Sale Price | Title Company |
|---|---|---|---|
| Fanning Living Trust | -- | Sapphire Law Group | |
| Fanning Vernon Michael | -- | Placer Title Company | |
| Lenci Sharyn | $410,000 | Financial Title Company | |
| Fanning Vernon Michael | $119,000 | -- | |
| Fanning Vernon Michael | -- | -- |
Source: Public Records
Mortgage History
| Date | Status | Borrower | Loan Amount |
|---|---|---|---|
| Previous Owner | Fanning Vernon Michael | $291,700 | |
| Previous Owner | Lenci Sharyn | $309,950 |
Source: Public Records
Tax History Compared to Growth
Tax History
| Year | Tax Paid | Tax Assessment Tax Assessment Total Assessment is a certain percentage of the fair market value that is determined by local assessors to be the total taxable value of land and additions on the property. | Land | Improvement |
|---|---|---|---|---|
| 2025 | $3,960 | $353,611 | $88,398 | $265,213 |
| 2024 | $3,960 | $346,678 | $86,665 | $260,013 |
| 2023 | $3,890 | $339,881 | $84,966 | $254,915 |
| 2022 | $3,832 | $333,217 | $83,300 | $249,917 |
| 2021 | $3,780 | $326,684 | $81,667 | $245,017 |
| 2020 | $3,733 | $323,335 | $80,830 | $242,505 |
| 2019 | $3,705 | $316,996 | $79,246 | $237,750 |
| 2018 | $3,618 | $310,782 | $77,693 | $233,089 |
| 2017 | $3,387 | $304,689 | $76,170 | $228,519 |
| 2016 | $3,410 | $298,716 | $74,677 | $224,039 |
| 2015 | $3,298 | $294,230 | $73,556 | $220,674 |
| 2014 | $3,135 | $288,468 | $72,116 | $216,352 |
Source: Public Records
Map
Nearby Homes
- 148 Big Valley Rd
- 106 Rhoades Way
- 148 Oak Mill Rd
- 164 Rebecca Way
- 124 Windstar Cir
- 1173 Boxelder Cir
- 1522 Thurman Way
- 1553 Bonanza Ln
- 1437 Cummings Way
- 1579 Bonanza Ln
- 1113 Kingfisher Cir
- 1118 Buckbrush Dr
- 801 Cristina Ct
- 1752 Parkway Dr N
- 128 Mesquite Ct
- 1480 Bicker Cir
- 1604 Thurman Way
- 1376 Folsom Meadows Cir N
- 1557 Borrasca Dr
- 1599 Ballou Cir
- 153 Livermore Way
- 149 Livermore Way
- 155 Livermore Way
- 147 Livermore Way
- 150 Livermore Way
- 148 Livermore Way
- 157 Livermore Way
- 145 Livermore Way
- 146 Livermore Way
- 152 Livermore Way
- 103 Lions Way
- 159 Livermore Way
- 143 Livermore Way
- 154 Livermore Way
- 144 Livermore Way
- 102 Lions Way
- 105 Lions Way
- 145 Goodell Rd
- 156 Livermore Way
- 161 Livermore Way