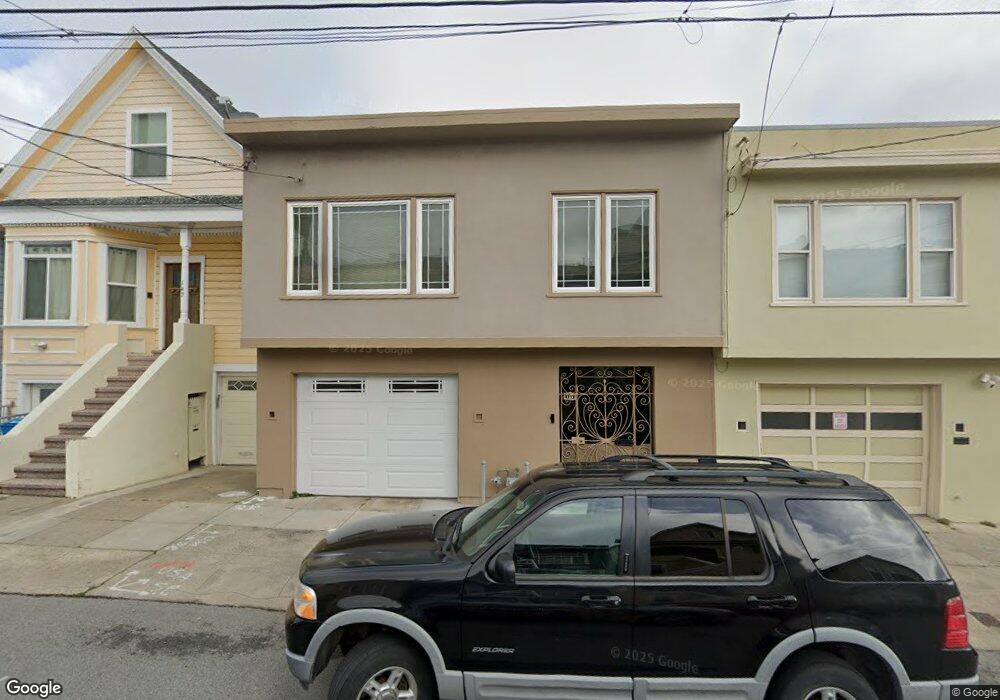
151 Maynard St San Francisco, CA 94112
Excelsior NeighborhoodEstimated Value: $1,084,000 - $1,243,868
Studio
2
Baths
1,400
Sq Ft
$830/Sq Ft
Est. Value
About This Home
This home is located at 151 Maynard St, San Francisco, CA 94112 and is currently estimated at $1,161,967, approximately $829 per square foot. 151 Maynard St is a home located in San Francisco County with nearby schools including Hillcrest Elementary School, King Jr. (Martin Luther) Academic Middle School, and Cornerstone Academy-Silver Campus.
Ownership History
Date
Name
Owned For
Owner Type
Purchase Details
Closed on
Feb 8, 2012
Sold by
Lopez Manuel
Bought by
Lopez Manuel and Lopez Maritza
Current Estimated Value
Purchase Details
Closed on
May 14, 2002
Sold by
Lopez Maritza
Bought by
Lopez Manuel
Home Financials for this Owner
Home Financials are based on the most recent Mortgage that was taken out on this home.
Original Mortgage
$225,000
Interest Rate
6.45%
Purchase Details
Closed on
May 13, 1999
Sold by
Emilia E Bustichi Trust and Emilia E
Bought by
Lopez Manuel and Lopez Maritza
Home Financials for this Owner
Home Financials are based on the most recent Mortgage that was taken out on this home.
Original Mortgage
$200,000
Interest Rate
6.92%
Create a Home Valuation Report for This Property
The Home Valuation Report is an in-depth analysis detailing your home's value as well as a comparison with similar homes in the area
Home Values in the Area
Average Home Value in this Area
Purchase History
| Date | Buyer | Sale Price | Title Company |
|---|---|---|---|
| Lopez Manuel | -- | None Available | |
| Lopez Manuel | -- | Chicago Title Co | |
| Lopez Manuel | $371,500 | Fidelity National Title Co |
Source: Public Records
Mortgage History
| Date | Status | Borrower | Loan Amount |
|---|---|---|---|
| Closed | Lopez Manuel | $225,000 | |
| Closed | Lopez Manuel | $200,000 |
Source: Public Records
Tax History
| Year | Tax Paid | Tax Assessment Tax Assessment Total Assessment is a certain percentage of the fair market value that is determined by local assessors to be the total taxable value of land and additions on the property. | Land | Improvement |
|---|---|---|---|---|
| 2025 | $7,478 | $582,382 | $349,432 | $232,950 |
| 2024 | $7,478 | $570,964 | $342,581 | $228,383 |
| 2023 | $7,358 | $559,769 | $335,864 | $223,905 |
| 2022 | $7,207 | $548,794 | $329,279 | $219,515 |
| 2021 | $7,076 | $538,034 | $322,823 | $215,211 |
| 2020 | $7,172 | $532,518 | $319,513 | $213,005 |
| 2019 | $6,882 | $522,078 | $313,249 | $208,829 |
| 2018 | $6,651 | $511,842 | $307,107 | $204,735 |
| 2017 | $6,275 | $501,807 | $301,086 | $200,721 |
| 2016 | $6,153 | $491,969 | $295,183 | $196,786 |
| 2015 | $6,076 | $484,581 | $290,750 | $193,831 |
| 2014 | $5,917 | $475,090 | $285,055 | $190,035 |
Source: Public Records
Map
Nearby Homes
Your Personal Tour Guide
Ask me questions while you tour the home.