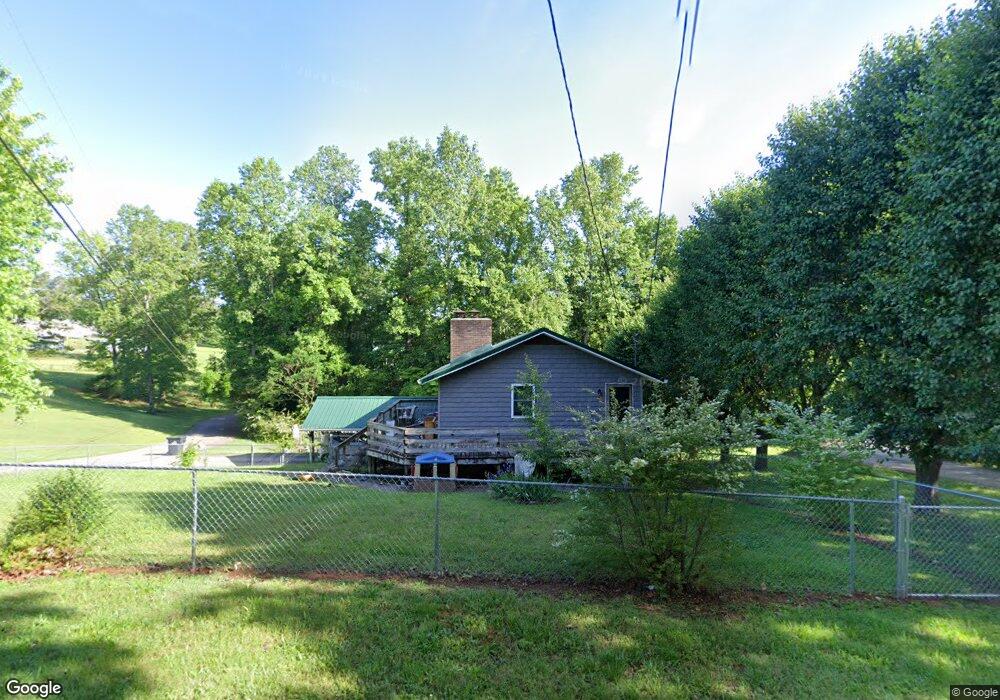
151 Rebel Rd Harriman, TN 37748
Estimated Value: $197,651 - $289,000
--
Bed
2
Baths
936
Sq Ft
$273/Sq Ft
Est. Value
About This Home
This home is located at 151 Rebel Rd, Harriman, TN 37748 and is currently estimated at $255,413, approximately $272 per square foot. 151 Rebel Rd is a home located in Roane County with nearby schools including Midtown Elementary School, Kingston Elementary School, and Midway Elementary School.
Ownership History
Date
Name
Owned For
Owner Type
Purchase Details
Closed on
May 2, 2014
Sold by
Topmiller Gary A
Bought by
Norris Jama R
Current Estimated Value
Home Financials for this Owner
Home Financials are based on the most recent Mortgage that was taken out on this home.
Original Mortgage
$64,000
Outstanding Balance
$48,975
Interest Rate
4.44%
Mortgage Type
New Conventional
Estimated Equity
$206,438
Purchase Details
Closed on
Dec 16, 2013
Sold by
Topmiller Paul
Bought by
Topmiller Gary A
Purchase Details
Closed on
Nov 29, 2013
Purchase Details
Closed on
Jul 15, 2004
Purchase Details
Closed on
Jun 28, 1984
Bought by
Topmiller Paul E
Create a Home Valuation Report for This Property
The Home Valuation Report is an in-depth analysis detailing your home's value as well as a comparison with similar homes in the area
Home Values in the Area
Average Home Value in this Area
Purchase History
| Date | Buyer | Sale Price | Title Company |
|---|---|---|---|
| Norris Jama R | $80,000 | -- | |
| Topmiller Gary A | $2,000 | -- | |
| -- | -- | -- | |
| Topmiller Gary A | $2,000 | -- | |
| Topmiller Gary A | $2,000 | -- | |
| -- | -- | -- | |
| Topmiller Paul E | -- | -- |
Source: Public Records
Mortgage History
| Date | Status | Borrower | Loan Amount |
|---|---|---|---|
| Open | Norris Jama R | $64,000 |
Source: Public Records
Tax History Compared to Growth
Tax History
| Year | Tax Paid | Tax Assessment Tax Assessment Total Assessment is a certain percentage of the fair market value that is determined by local assessors to be the total taxable value of land and additions on the property. | Land | Improvement |
|---|---|---|---|---|
| 2024 | $618 | $25,750 | $5,325 | $20,425 |
| 2023 | $618 | $25,750 | $5,325 | $20,425 |
| 2022 | $618 | $25,750 | $5,325 | $20,425 |
| 2021 | $636 | $25,750 | $5,325 | $20,425 |
| 2020 | $636 | $25,750 | $5,325 | $20,425 |
| 2019 | $536 | $19,950 | $5,625 | $14,325 |
| 2018 | $514 | $19,950 | $5,625 | $14,325 |
| 2017 | $514 | $19,950 | $5,625 | $14,325 |
| 2016 | $514 | $19,950 | $5,625 | $14,325 |
| 2015 | $514 | $19,950 | $5,625 | $14,325 |
| 2013 | -- | $28,925 | $5,400 | $23,525 |
Source: Public Records
Map
Nearby Homes
- 213 Westshore Dr
- 120 Hilltop Rd
- 103 Nelson Place
- 212 Reba Ave
- 219 Reba Ave
- 312 Lakeview Rd
- 140 Charles Place
- 517 Bowman Bend Rd
- 1700 Bluff Rd
- 734 Bowman Bend Rd
- 209 Ponderosa Dr
- 136 White Oak Dr
- 120 Brahman Rd
- 0 Decatur Hwy
- 1218 S Kentucky St
- 233 Duncan Hollow Rd
- 160 Casey Rd
- 233 Old Highway 70
- 1201 Blossom Ln
- 3002 Brentwood Ct
- 175 Rebel Rd
- 155 Rebel Rd
- 195 Rebel Rd
- 167 Rebel Rd
- 169 Rebel Rd
- 166 Rebel Rd
- 161 Rebel Rd
- 172 Rebel Rd
- 135 Rebel Rd
- 154 Rebel Rd
- 190 Rebel Rd
- 159 Rebel Rd
- 129 Rebel Rd
- 0 Rebel Rd Unit 20153495
- 0 Rebel Rd Unit 930620
- 0 Rebel Rd Unit 933554
- 0 Rebel Rd Unit 1069087
- 163 Rebel Rd
- 142 Rebel Rd
- 136 Rebel Rd