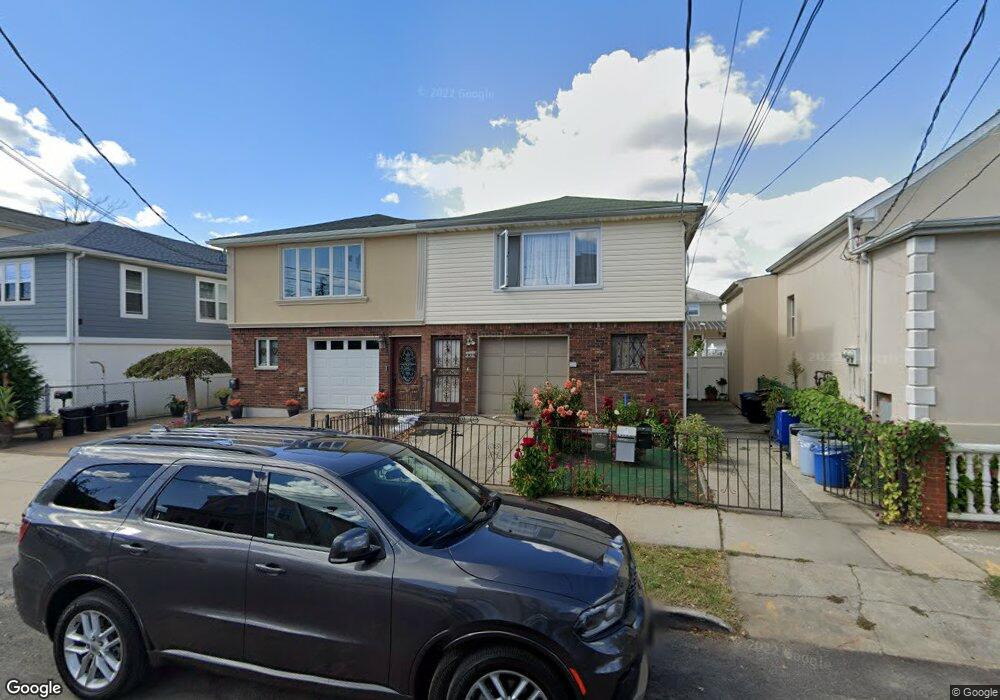
151 Roma Ave Unit HOUSE Staten Island, NY 10306
New Dorp Beach NeighborhoodEstimated Value: $778,679 - $1,015,000
4
Beds
2
Baths
2,100
Sq Ft
$424/Sq Ft
Est. Value
About This Home
This home is located at 151 Roma Ave Unit HOUSE, Staten Island, NY 10306 and is currently estimated at $889,670, approximately $423 per square foot. 151 Roma Ave Unit HOUSE is a home located in Richmond County with nearby schools including P.S. 41 The Stephanie a Vierno School, Is 2 George L Egbert, and New Dorp High School.
Ownership History
Date
Name
Owned For
Owner Type
Purchase Details
Closed on
Mar 25, 2013
Sold by
Perzaic Mujo and Perzaic Saime
Bought by
Saime Perzaic Mujo and Saime Perzaid
Current Estimated Value
Home Financials for this Owner
Home Financials are based on the most recent Mortgage that was taken out on this home.
Original Mortgage
$6,863
Interest Rate
3.55%
Mortgage Type
New Conventional
Create a Home Valuation Report for This Property
The Home Valuation Report is an in-depth analysis detailing your home's value as well as a comparison with similar homes in the area
Home Values in the Area
Average Home Value in this Area
Purchase History
| Date | Buyer | Sale Price | Title Company |
|---|---|---|---|
| Saime Perzaic Mujo | -- | Westcor Land Title Ins Co |
Source: Public Records
Mortgage History
| Date | Status | Borrower | Loan Amount |
|---|---|---|---|
| Closed | Saime Perzaic Mujo | $6,863 |
Source: Public Records
Tax History Compared to Growth
Tax History
| Year | Tax Paid | Tax Assessment Tax Assessment Total Assessment is a certain percentage of the fair market value that is determined by local assessors to be the total taxable value of land and additions on the property. | Land | Improvement |
|---|---|---|---|---|
| 2025 | $6,389 | $43,440 | $4,914 | $38,526 |
| 2024 | $6,389 | $43,500 | $4,871 | $38,629 |
| 2023 | $6,095 | $30,012 | $4,496 | $25,516 |
| 2022 | $5,652 | $38,580 | $6,660 | $31,920 |
| 2021 | $5,622 | $37,020 | $6,660 | $30,360 |
| 2020 | $5,654 | $34,260 | $6,660 | $27,600 |
| 2019 | $5,546 | $32,520 | $6,660 | $25,860 |
| 2018 | $5,098 | $25,010 | $5,552 | $19,458 |
| 2017 | $4,810 | $23,595 | $5,885 | $17,710 |
| 2016 | $4,450 | $22,260 | $6,660 | $15,600 |
| 2015 | $4,272 | $22,260 | $6,660 | $15,600 |
| 2014 | $4,272 | $22,260 | $6,660 | $15,600 |
Source: Public Records
Map
Nearby Homes