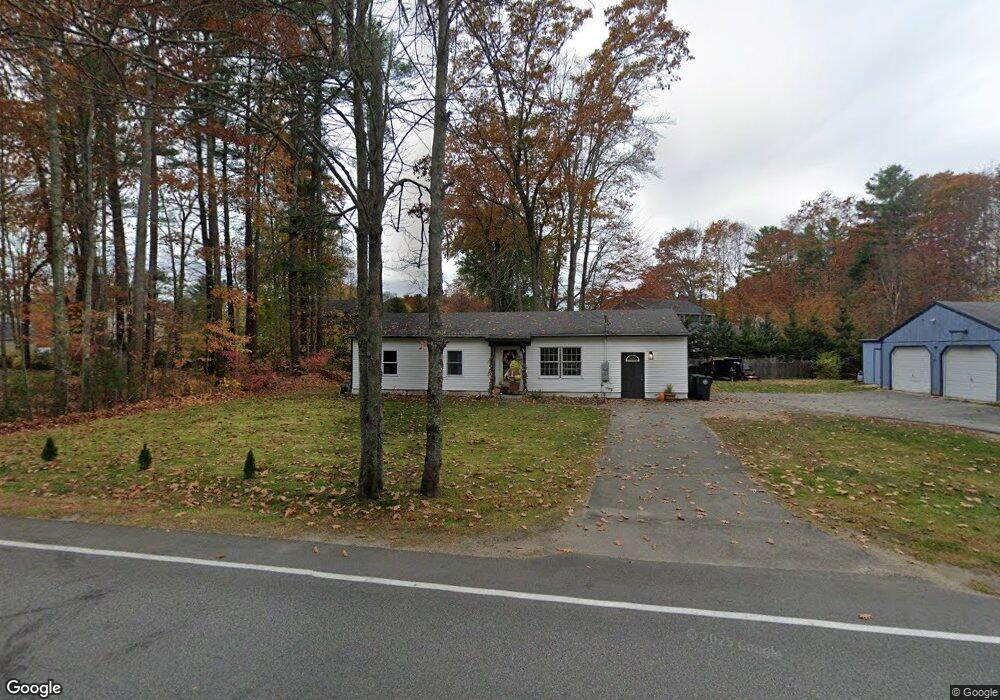
151 Ross Rd Kennebunk, ME 04043
Estimated Value: $385,000 - $465,000
3
Beds
1
Bath
1,000
Sq Ft
$415/Sq Ft
Est. Value
About This Home
This home is located at 151 Ross Rd, Kennebunk, ME 04043 and is currently estimated at $414,865, approximately $414 per square foot. 151 Ross Rd is a home located in York County with nearby schools including Kennebunk High School.
Ownership History
Date
Name
Owned For
Owner Type
Purchase Details
Closed on
Sep 8, 2023
Sold by
Hart Marjorie Est and Walker
Bought by
Simeoni Candice L
Current Estimated Value
Home Financials for this Owner
Home Financials are based on the most recent Mortgage that was taken out on this home.
Original Mortgage
$242,250
Outstanding Balance
$236,492
Interest Rate
6.81%
Mortgage Type
Purchase Money Mortgage
Estimated Equity
$178,373
Create a Home Valuation Report for This Property
The Home Valuation Report is an in-depth analysis detailing your home's value as well as a comparison with similar homes in the area
Home Values in the Area
Average Home Value in this Area
Purchase History
| Date | Buyer | Sale Price | Title Company |
|---|---|---|---|
| Simeoni Candice L | $255,000 | None Available | |
| Simeoni Candice L | $255,000 | None Available | |
| Simeoni Candice L | $255,000 | None Available |
Source: Public Records
Mortgage History
| Date | Status | Borrower | Loan Amount |
|---|---|---|---|
| Open | Simeoni Candice L | $242,250 | |
| Closed | Simeoni Candice L | $242,250 |
Source: Public Records
Tax History
| Year | Tax Paid | Tax Assessment Tax Assessment Total Assessment is a certain percentage of the fair market value that is determined by local assessors to be the total taxable value of land and additions on the property. | Land | Improvement |
|---|---|---|---|---|
| 2024 | $3,549 | $209,400 | $0 | $0 |
| 2023 | $3,322 | $207,000 | $83,200 | $123,800 |
| 2022 | $3,022 | $207,000 | $83,200 | $123,800 |
| 2021 | $2,594 | $207,000 | $83,200 | $123,800 |
| 2020 | $2,417 | $207,000 | $83,200 | $123,800 |
| 2019 | $2,321 | $207,000 | $83,200 | $123,800 |
| 2018 | $2,718 | $155,300 | $62,400 | $92,900 |
| 2017 | $2,570 | $155,300 | $62,400 | $92,900 |
| 2016 | $2,336 | $154,300 | $62,400 | $91,900 |
| 2015 | $2,215 | $154,300 | $62,400 | $91,900 |
| 2014 | $2,158 | $154,300 | $62,400 | $91,900 |
Source: Public Records
Map
Nearby Homes
- 115 Fletcher St
- 22 Oakwood Ln
- 3 Hardwood Ln
- 18 Longwood Dr
- 15 Casey Ln
- 2 Lexington Dr Unit 2
- 7 Windsor Commons Dr Unit 7
- 61 Fletcher St
- 3 Kensington Dr
- 23 Lilac Ln
- 14 Hampton Glen Dr Unit 51
- 9 Hampton Glen Dr Unit 3
- 17 Hampton Glen Dr Unit 5
- 29 Hampton Glen Dr Unit 10
- 23 Cascade Cir Unit 22
- 0 Potvin Rd
- 24 Cat Mousam Rd
- 93 Main St Unit A
- 2 Cross St
- 14 Summer St Unit 6
Your Personal Tour Guide
Ask me questions while you tour the home.