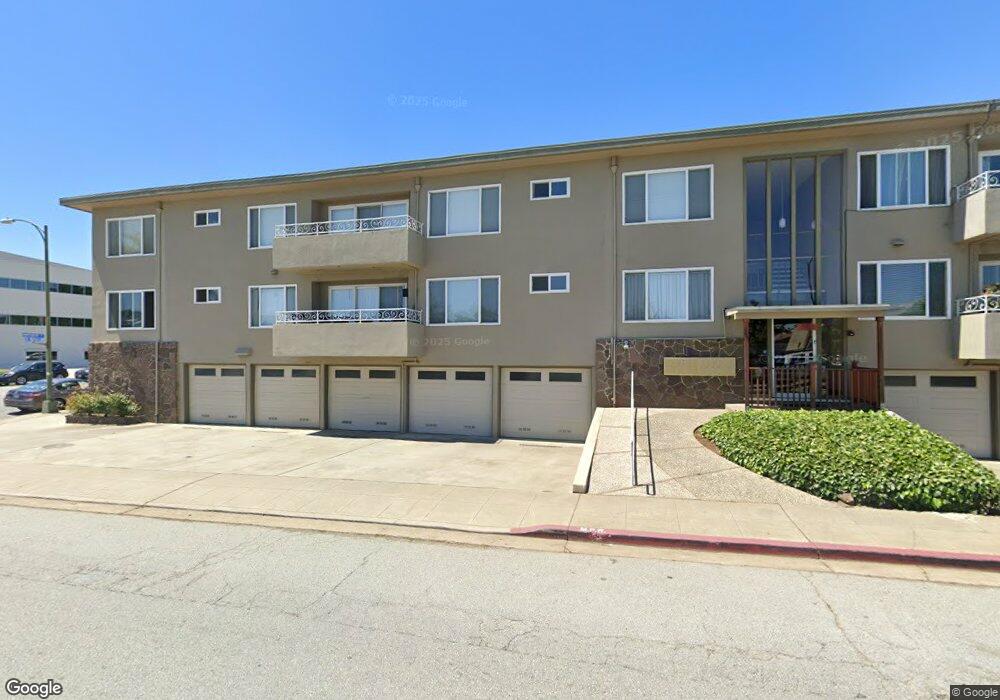
151 S Magnolia Ave Unit 10 Millbrae, CA 94030
Estimated Value: $742,267 - $1,126,000
2
Beds
1
Bath
929
Sq Ft
$966/Sq Ft
Est. Value
About This Home
This home is located at 151 S Magnolia Ave Unit 10, Millbrae, CA 94030 and is currently estimated at $897,817, approximately $966 per square foot. 151 S Magnolia Ave Unit 10 is a home located in San Mateo County with nearby schools including Spring Valley Elementary School, Taylor Middle School, and Mills High School.
Ownership History
Date
Name
Owned For
Owner Type
Purchase Details
Closed on
Jun 10, 2012
Sold by
Lee Angela
Bought by
Lee Angela
Current Estimated Value
Purchase Details
Closed on
May 16, 2011
Sold by
Us Bank National Association
Bought by
Lee Angela
Home Financials for this Owner
Home Financials are based on the most recent Mortgage that was taken out on this home.
Original Mortgage
$320,000
Outstanding Balance
$219,806
Interest Rate
4.63%
Mortgage Type
New Conventional
Estimated Equity
$678,011
Purchase Details
Closed on
Feb 24, 2011
Sold by
Cheng Lucia and Cheng Albert E
Bought by
Us Bank National Association
Purchase Details
Closed on
Nov 28, 2005
Sold by
Ja Partnership
Bought by
Cheng Albert E and Cheng Lucia
Home Financials for this Owner
Home Financials are based on the most recent Mortgage that was taken out on this home.
Original Mortgage
$426,400
Interest Rate
5.37%
Mortgage Type
Purchase Money Mortgage
Create a Home Valuation Report for This Property
The Home Valuation Report is an in-depth analysis detailing your home's value as well as a comparison with similar homes in the area
Home Values in the Area
Average Home Value in this Area
Purchase History
| Date | Buyer | Sale Price | Title Company |
|---|---|---|---|
| Lee Angela | -- | None Available | |
| Lee Angela | $401,000 | Servicelink | |
| Us Bank National Association | $410,000 | Accommodation | |
| Cheng Albert E | $533,000 | Chicago Title Company |
Source: Public Records
Mortgage History
| Date | Status | Borrower | Loan Amount |
|---|---|---|---|
| Open | Lee Angela | $320,000 | |
| Previous Owner | Cheng Albert E | $426,400 |
Source: Public Records
Tax History Compared to Growth
Tax History
| Year | Tax Paid | Tax Assessment Tax Assessment Total Assessment is a certain percentage of the fair market value that is determined by local assessors to be the total taxable value of land and additions on the property. | Land | Improvement |
|---|---|---|---|---|
| 2025 | $6,871 | $513,738 | $153,735 | $360,003 |
| 2023 | $6,871 | $493,791 | $147,766 | $346,025 |
| 2022 | $5,524 | $484,110 | $144,869 | $339,241 |
| 2021 | $5,558 | $474,619 | $142,029 | $332,590 |
| 2020 | $5,470 | $469,753 | $140,573 | $329,180 |
| 2019 | $5,343 | $460,543 | $137,817 | $322,726 |
| 2018 | $5,240 | $451,514 | $135,115 | $316,399 |
| 2017 | $5,068 | $442,662 | $132,466 | $310,196 |
| 2016 | $4,996 | $433,983 | $129,869 | $304,114 |
| 2015 | $4,961 | $427,465 | $127,919 | $299,546 |
| 2014 | $4,850 | $419,093 | $125,414 | $293,679 |
Source: Public Records
Map
Nearby Homes
- 88 S Broadway Unit 2101
- 100 Millbrae Ave
- 151 El Camino Real None Unit 402
- 1838 Ogden Dr Unit 413
- 335 Cuardo Ave
- 450 Laurel Ave
- 8 Millbrae Cir
- 1209 Lake St
- 840 El Camino Real
- 555 Palm Ave Unit 207
- 211 Anita Dr
- 1151 Eastmoor Rd
- 2705 Arguello Dr
- 1445 Balboa Ave
- 43 Aura Vista
- 1421 El Camino Real Unit 6
- 1820 Capistrano Way
- 90 Conejo Dr
- 15 Mullins Ct
- 2955 Trousdale Dr
- 151 S Magnolia Ave Unit 1
- 151 S Magnolia Ave Unit 6
- 151 S Magnolia Ave Unit 5
- 151 S Magnolia Ave Unit 4
- 151 S Magnolia Ave Unit 3
- 151 S Magnolia Ave Unit 2
- 151 S Magnolia Ave Unit 1
- 151 S Magnolia Ave Unit 12
- 151 S Magnolia Ave Unit 11
- 151 S Magnolia Ave Unit 9
- 151 S Magnolia Ave Unit 8
- 151 S Magnolia Ave Unit 7
- 141 S Magnolia Ave
- 121 S Magnolia Ave Unit 2
- 121 S Magnolia Ave Unit 1
- 121 S Magnolia Ave
- 111 S Magnolia Ave
- 300 Murchison Dr Unit 316
- 300 Murchison Dr Unit 315
- 300 Murchison Dr Unit 208