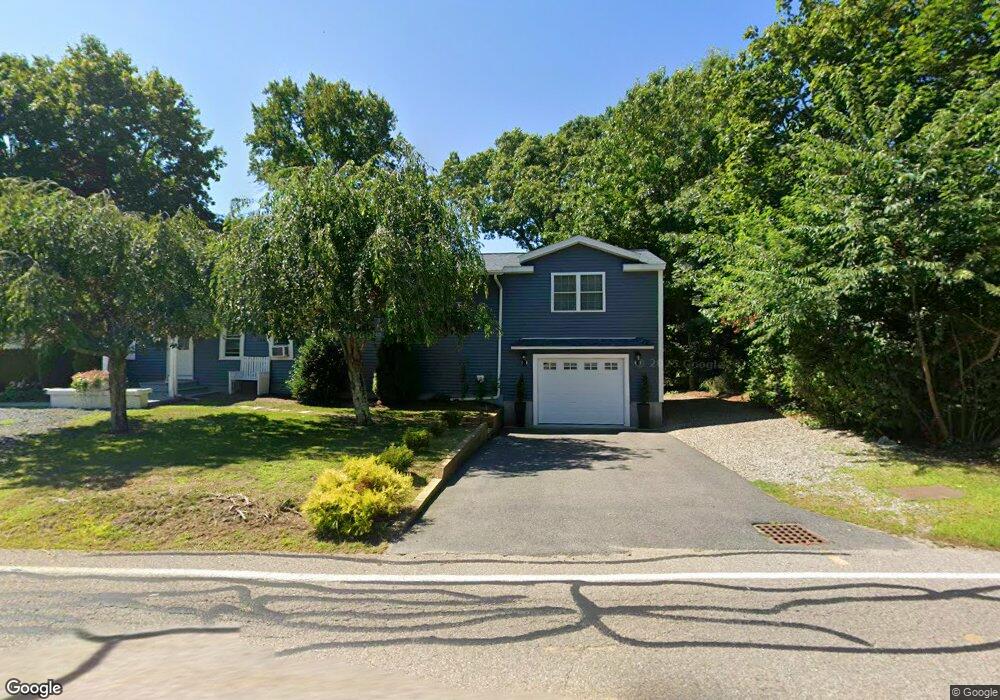
151 S Worcester St Norton, MA 02766
Estimated Value: $525,000 - $555,701
3
Beds
2
Baths
1,452
Sq Ft
$373/Sq Ft
Est. Value
About This Home
This home is located at 151 S Worcester St, Norton, MA 02766 and is currently estimated at $540,925, approximately $372 per square foot. 151 S Worcester St is a home located in Bristol County with nearby schools including J.C. Solmonese Elementary School, Henri A. Yelle Elementary School, and Norton Middle School.
Ownership History
Date
Name
Owned For
Owner Type
Purchase Details
Closed on
Apr 14, 2006
Sold by
Luti Joann and Luti John P
Bought by
Luti Joann
Current Estimated Value
Purchase Details
Closed on
Sep 14, 2001
Sold by
Raleigh Christopher C and Raleigh April M
Bought by
Luti John P and Luti Joann
Home Financials for this Owner
Home Financials are based on the most recent Mortgage that was taken out on this home.
Original Mortgage
$163,400
Interest Rate
6.99%
Mortgage Type
Purchase Money Mortgage
Purchase Details
Closed on
Jun 24, 1999
Sold by
Robbins David J and Robbins Dolores A
Bought by
Raleigh Christopher C and Kuketz April M
Purchase Details
Closed on
Oct 25, 1995
Sold by
Robbins David J and Robbins Dolores
Bought by
Sher Corp Ltd
Create a Home Valuation Report for This Property
The Home Valuation Report is an in-depth analysis detailing your home's value as well as a comparison with similar homes in the area
Home Values in the Area
Average Home Value in this Area
Purchase History
| Date | Buyer | Sale Price | Title Company |
|---|---|---|---|
| Luti Joann | -- | -- | |
| Luti John P | $168,500 | -- | |
| Raleigh Christopher C | $145,000 | -- | |
| Sher Corp Ltd | $2,000 | -- |
Source: Public Records
Mortgage History
| Date | Status | Borrower | Loan Amount |
|---|---|---|---|
| Open | Sher Corp Ltd | $121,000 | |
| Previous Owner | Sher Corp Ltd | $167,000 | |
| Previous Owner | Sher Corp Ltd | $163,400 |
Source: Public Records
Tax History
| Year | Tax Paid | Tax Assessment Tax Assessment Total Assessment is a certain percentage of the fair market value that is determined by local assessors to be the total taxable value of land and additions on the property. | Land | Improvement |
|---|---|---|---|---|
| 2025 | $62 | $481,700 | $146,800 | $334,900 |
| 2024 | $5,941 | $458,800 | $139,800 | $319,000 |
| 2023 | $5,627 | $433,200 | $131,900 | $301,300 |
| 2022 | $5,473 | $383,800 | $119,900 | $263,900 |
| 2021 | $5,143 | $344,500 | $114,200 | $230,300 |
| 2020 | $3,892 | $263,000 | $110,900 | $152,100 |
| 2019 | $3,375 | $226,500 | $101,000 | $125,500 |
| 2018 | $3,282 | $216,500 | $101,000 | $115,500 |
| 2017 | $3,198 | $208,100 | $101,000 | $107,100 |
| 2016 | $3,102 | $198,700 | $101,000 | $97,700 |
| 2015 | $2,989 | $194,200 | $99,000 | $95,200 |
| 2014 | $2,847 | $185,200 | $94,300 | $90,900 |
Source: Public Records
Map
Nearby Homes
- 170 S Worcester St Unit 3
- 178 S Worcester St
- 3 Heritage Rd Unit 3
- 1 Heritage Rd Unit 1
- 108 S Worcester St
- 2 Edgewater Dr Unit 2
- 8 Country Cir
- 26 Barrows Ct
- 60 S Worcester St
- 286 S Worcester St
- 8 Goldenwood Dr Unit 8
- 127 John Scott Blvd
- 125 John Scott Blvd
- 55 Sturdy St
- 53 Sturdy St
- 20 Freeman St
- 83 W Main St
- 6 Robin Cir Unit 1
- 18 Slater St
- 10 Anna Way
- 155 S Worcester St
- 155 S Worcester St Unit 155
- 149 S Worcester St
- 74 Stephen St
- 157 S Worcester St
- 157 S Worcester St Unit 2
- 156 S Worcester St
- 152 S Worcester St
- 145 S Worcester St
- 159 S Worcester St
- 158 S Worcester St
- 144 S Worcester St
- 143 S Worcester St
- 14 Stephen St
- 163 S Worcester St
- 13 Stephen St
- 164 S Worcester St
- 141 S Worcester St
- 12 Stephen St
- 11 Stephen St
Your Personal Tour Guide
Ask me questions while you tour the home.