1510 9th St Hobbs, NM 88240
Eunice NeighborhoodEstimated Value: $74,000 - $185,000
3
Beds
2
Baths
1,926
Sq Ft
$76/Sq Ft
Est. Value
About This Home
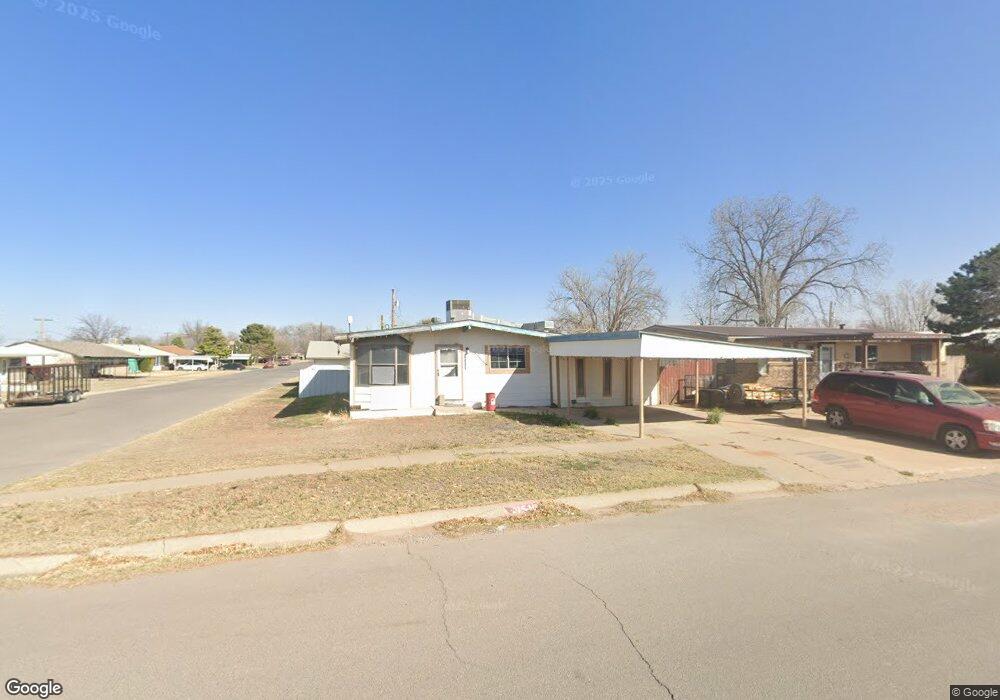
This home is located at 1510 9th St, Hobbs, NM 88240 and is currently estimated at $146,795, approximately $76 per square foot. 1510 9th St is a home located in Lea County with nearby schools including Mettie Jordan Elementary School, Caton Middle School, and Eunice High School.
Ownership History
Date
Name
Owned For
Owner Type
Purchase Details
Closed on
Feb 8, 2024
Sold by
Robinson Richard Keith
Bought by
Tellez Adela Y and Tellez David
Current Estimated Value
Purchase Details
Closed on
Oct 1, 2019
Sold by
Harris Crystal Nicole
Bought by
Robinson Richard Keith
Purchase Details
Closed on
Mar 29, 2019
Sold by
Robinson William M and Robinson Shelly A
Bought by
Robinson Richard K and Harris Crystal N
Home Financials for this Owner
Home Financials are based on the most recent Mortgage that was taken out on this home.
Original Mortgage
$97,750
Interest Rate
4.3%
Mortgage Type
New Conventional
Purchase Details
Closed on
Dec 23, 2010
Sold by
Robinson William R and Robinson Shelly A
Bought by
Robinson Shelly A
Home Financials for this Owner
Home Financials are based on the most recent Mortgage that was taken out on this home.
Original Mortgage
$7,220,000
Interest Rate
4.36%
Mortgage Type
FHA
Create a Home Valuation Report for This Property
The Home Valuation Report is an in-depth analysis detailing your home's value as well as a comparison with similar homes in the area
Home Values in the Area
Average Home Value in this Area
Purchase History
| Date | Buyer | Sale Price | Title Company |
|---|---|---|---|
| Tellez Adela Y | -- | None Listed On Document | |
| Robinson Richard Keith | -- | None Available | |
| Robinson Richard K | -- | None Available | |
| Robinson Shelly A | -- | -- |
Source: Public Records
Mortgage History
| Date | Status | Borrower | Loan Amount |
|---|---|---|---|
| Previous Owner | Robinson Richard K | $97,750 | |
| Previous Owner | Robinson Shelly A | $7,220,000 |
Source: Public Records
Tax History Compared to Growth
Tax History
| Year | Tax Paid | Tax Assessment Tax Assessment Total Assessment is a certain percentage of the fair market value that is determined by local assessors to be the total taxable value of land and additions on the property. | Land | Improvement |
|---|---|---|---|---|
| 2024 | $971 | $38,860 | $3,777 | $35,083 |
| 2023 | $962 | $37,728 | $3,667 | $34,061 |
| 2022 | $957 | $37,728 | $3,667 | $34,061 |
| 2021 | $1,035 | $37,728 | $3,667 | $34,061 |
| 2020 | $1,179 | $37,728 | $3,667 | $34,061 |
| 2019 | $579 | $17,260 | $1,061 | $16,199 |
| 2018 | $579 | $17,260 | $1,061 | $16,199 |
| 2017 | $580 | $51,780 | $3,183 | $48,597 |
| 2016 | $584 | $51,780 | $3,183 | $48,597 |
| 2015 | $466 | $51,780 | $3,183 | $48,597 |
| 2014 | -- | $51,780 | $3,183 | $48,597 |
Source: Public Records
Map
Nearby Homes
- 804 Avenue P
- 1824 Eunice Bypass Rd
- 909 9th St
- 1212 15th St
- 1605 Avenue S
- 1608 19th St
- 201 Continental Rd
- TBD Lot 6 Eunice Nm
- TBD E Starlight Rd
- 7325 S Eunice Hwy Unit ST18
- 8201 S Stone Rd
- 5807 S Eunice Hwy Unit ST18
- 6824 New Mexico 8
- 7104 S Cook St
- 414 E Arco Rd
- 500 & 500 1/2 E Stanolind Rd
- 1236 S Short St
- 0 County Road 341 Unit 202413488
- 1206 S Houston St
- 412 W Texas St