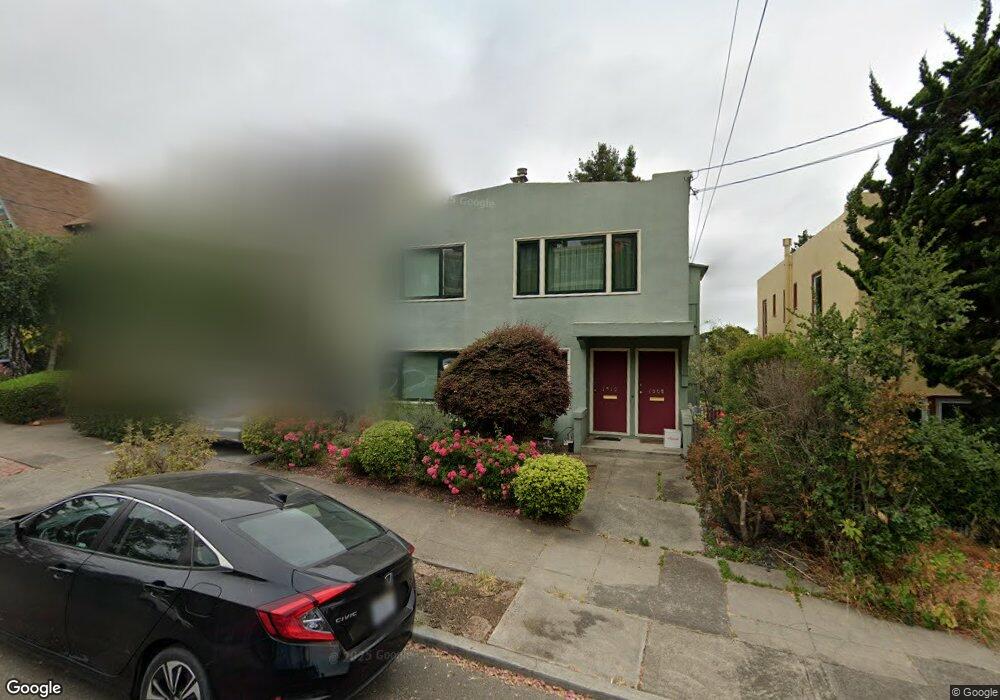
1510 Grant St Berkeley, CA 94703
North Berkeley NeighborhoodEstimated Value: $878,000 - $2,036,000
4
Beds
2
Baths
2,048
Sq Ft
$719/Sq Ft
Est. Value
About This Home
This home is located at 1510 Grant St, Berkeley, CA 94703 and is currently estimated at $1,473,128, approximately $719 per square foot. 1510 Grant St is a home located in Alameda County with nearby schools including Berkeley Arts Magnet at Whittier School, Ruth Acty Elementary, and Thousand Oaks Elementary School.
Ownership History
Date
Name
Owned For
Owner Type
Purchase Details
Closed on
Nov 5, 2021
Sold by
Henrich Ruth
Bought by
Henrich Ruth and Ruth Henrich Trust
Current Estimated Value
Purchase Details
Closed on
May 12, 2008
Sold by
Baer Philip Charles and The Marjorie Ellen Baer Trust
Bought by
Henrich Ruth
Purchase Details
Closed on
Aug 10, 2006
Sold by
Baer Marjorie
Bought by
Baer Marjorie Ellen and Marjorie Ellen Baer Trust
Purchase Details
Closed on
Feb 9, 2000
Sold by
Dennis Zickerman
Bought by
Baer Marjorie and Henrich Ruth
Home Financials for this Owner
Home Financials are based on the most recent Mortgage that was taken out on this home.
Original Mortgage
$400,000
Interest Rate
8.37%
Create a Home Valuation Report for This Property
The Home Valuation Report is an in-depth analysis detailing your home's value as well as a comparison with similar homes in the area
Home Values in the Area
Average Home Value in this Area
Purchase History
| Date | Buyer | Sale Price | Title Company |
|---|---|---|---|
| Henrich Ruth | -- | None Available | |
| Henrich Ruth | -- | None Available | |
| Baer Marjorie Ellen | -- | None Available | |
| Baer Marjorie | $500,000 | New Century Title Company |
Source: Public Records
Mortgage History
| Date | Status | Borrower | Loan Amount |
|---|---|---|---|
| Previous Owner | Baer Marjorie | $400,000 |
Source: Public Records
Tax History
| Year | Tax Paid | Tax Assessment Tax Assessment Total Assessment is a certain percentage of the fair market value that is determined by local assessors to be the total taxable value of land and additions on the property. | Land | Improvement |
|---|---|---|---|---|
| 2025 | $12,701 | $738,415 | $223,624 | $521,791 |
| 2024 | $12,701 | $723,801 | $219,240 | $511,561 |
| 2023 | $12,423 | $716,475 | $214,942 | $501,533 |
| 2022 | $12,166 | $695,428 | $210,728 | $491,700 |
| 2021 | $12,173 | $681,660 | $206,598 | $482,062 |
| 2020 | $11,432 | $681,601 | $204,480 | $477,121 |
| 2019 | $10,888 | $668,240 | $200,472 | $467,768 |
| 2018 | $10,686 | $655,141 | $196,542 | $458,599 |
| 2017 | $10,303 | $642,297 | $192,689 | $449,608 |
| 2016 | $9,912 | $629,705 | $188,911 | $440,794 |
| 2015 | $9,771 | $620,248 | $186,074 | $434,174 |
| 2014 | $9,767 | $608,101 | $182,430 | $425,671 |
Source: Public Records
Map
Nearby Homes
- 1425 Martin Luther King jr Way
- 1609 Bonita Ave Unit 3
- 1609 Bonita Ave Unit 5
- 1610 Milvia St
- 2012 Rose St
- 2015 Delaware St
- 2015 Delaware St Unit A
- 1564 Sacramento St
- 1440 Walnut St Unit 5
- 1444 Walnut St
- 2201 Virginia St Unit 2
- 1813 Sacramento St
- 1512 Hearst Ave Unit 1512
- 1436 Delaware St
- 1360 Acton St
- 1411 Hearst Ave Unit 2
- 2218 -2222 Grant St
- 2340 Virginia St
- 1471 Scenic Ave
- 2118 California St
- 1504 Grant St Unit 1504 Grant St
- 1504 Grant St
- 1512 Grant St
- 1756 Vine St
- 1500 Grant St
- 1514 Grant St
- 1752 Vine St
- 1516 Grant St
- 1518 Grant St
- 1509 Edith St
- 1507 Edith St
- 1511 Grant St
- 1507 Grant St
- 1511 Edith St
- 1503 Edith St
- 1515 Grant St
- 1810 Vine St
- 1522 Grant St Unit rear
- 1522 Grant St
- 1515 Edith St
Your Personal Tour Guide
Ask me questions while you tour the home.