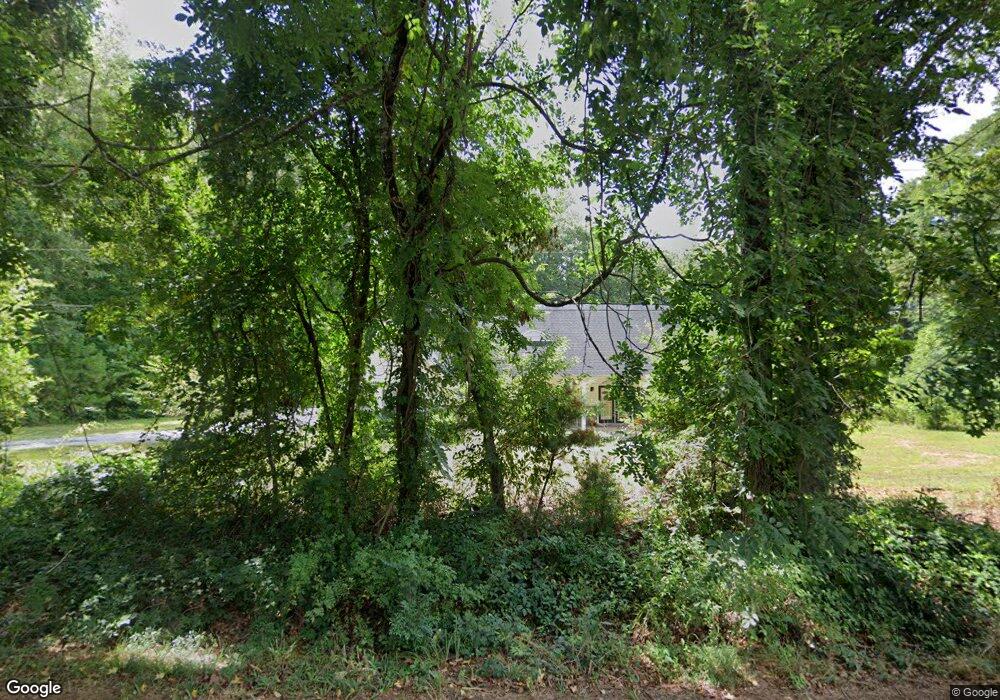
1510 Harris Bridge Rd Anderson, SC 29621
Estimated Value: $230,000 - $454,000
4
Beds
3
Baths
2,400
Sq Ft
$140/Sq Ft
Est. Value
About This Home
This home is located at 1510 Harris Bridge Rd, Anderson, SC 29621 and is currently estimated at $337,000, approximately $140 per square foot. 1510 Harris Bridge Rd is a home located in Anderson County with nearby schools including North Pointe Elementary School, McCants Middle School, and T.L. Hanna High School.
Ownership History
Date
Name
Owned For
Owner Type
Purchase Details
Closed on
Sep 26, 2024
Sold by
Chappelear & Associates Inc
Bought by
Ambria Properties Llc
Current Estimated Value
Purchase Details
Closed on
Mar 29, 2024
Sold by
Pierce Zachary M
Bought by
Chappelear & Associates Inc
Purchase Details
Closed on
Feb 8, 2013
Sold by
Ambria Properties Llc
Bought by
Pierce Zachary M
Home Financials for this Owner
Home Financials are based on the most recent Mortgage that was taken out on this home.
Original Mortgage
$159,600
Interest Rate
3.35%
Mortgage Type
New Conventional
Purchase Details
Closed on
Aug 30, 2012
Sold by
White William B and White Courtney B
Bought by
Ambria Properties Llc
Purchase Details
Closed on
Apr 13, 2010
Sold by
Clary David E
Bought by
White William B and White Courtney B
Create a Home Valuation Report for This Property
The Home Valuation Report is an in-depth analysis detailing your home's value as well as a comparison with similar homes in the area
Home Values in the Area
Average Home Value in this Area
Purchase History
| Date | Buyer | Sale Price | Title Company |
|---|---|---|---|
| Ambria Properties Llc | $90,000 | None Listed On Document | |
| Chappelear & Associates Inc | $250,000 | None Listed On Document | |
| Pierce Zachary M | $222,600 | -- | |
| Ambria Properties Llc | $38,000 | -- | |
| White William B | $27,500 | -- |
Source: Public Records
Mortgage History
| Date | Status | Borrower | Loan Amount |
|---|---|---|---|
| Previous Owner | Pierce Zachary M | $159,600 |
Source: Public Records
Tax History Compared to Growth
Tax History
| Year | Tax Paid | Tax Assessment Tax Assessment Total Assessment is a certain percentage of the fair market value that is determined by local assessors to be the total taxable value of land and additions on the property. | Land | Improvement |
|---|---|---|---|---|
| 2024 | $3,388 | $10,340 | $2,660 | $7,680 |
| 2023 | $3,388 | $10,340 | $2,660 | $7,680 |
| 2022 | $1,229 | $10,340 | $2,660 | $7,680 |
| 2021 | $1,136 | $9,340 | $2,480 | $6,860 |
| 2020 | $1,125 | $9,340 | $2,480 | $6,860 |
| 2019 | $1,125 | $9,340 | $2,480 | $6,860 |
| 2018 | $1,145 | $9,340 | $2,480 | $6,860 |
| 2017 | $1,096 | $9,340 | $2,480 | $6,860 |
| 2016 | $1,096 | $8,900 | $2,460 | $6,440 |
| 2015 | $1,121 | $13,360 | $3,700 | $9,660 |
| 2014 | $4,185 | $3,700 | $3,700 | $0 |
Source: Public Records
Map
Nearby Homes
- 11 Fieldstone Way
- 4204 Weatherstone Way
- 1026 Harpers Way
- 1021 Hobby Ln
- 1051 Dalrymple Rd
- 102 Bradford Way
- Lot 4 Little Creek Rd
- Lot 2 Little Creek Rd
- 1000 Whisper Wood Ln
- 2202 Concord Rd
- 102 Stoneleigh Ct
- 114 Baybrooke Ln
- 1003 Summer Place
- 2030 Donaldson Rd
- 127 Cathey Rd
- 416 Ashley Downs
- 3080 McGee Rd
- 126 Wycombe Dr
- 1009 McBane Ct
- 1003 Tuscany Dr
- 1510 Harris Bridge Rd Unit Tract 2
- 900 Cricket Ln
- 1505 Harris Bridge Rd
- 1503 Harris Bridge Rd
- 940 Little Creek Rd
- 1601 Harris Bridge Rd
- 903 Cricket Ln
- 1502 Harris Bridge Rd
- 107 Fieldstone Way
- 905 Cricket Ln
- 1605 Harris Bridge Rd
- 1501 Harris Bridge Rd
- 1509 Harris Bridge Rd
- 914 Cricket Ln
- 1700 Harris Bridge Rd
- 1704 Harris Bridge Rd
- 915 Cricket Ln
- 114 Fieldstone Way
- 108 Fieldstone Way
- Tract 11 Fieldstone Way