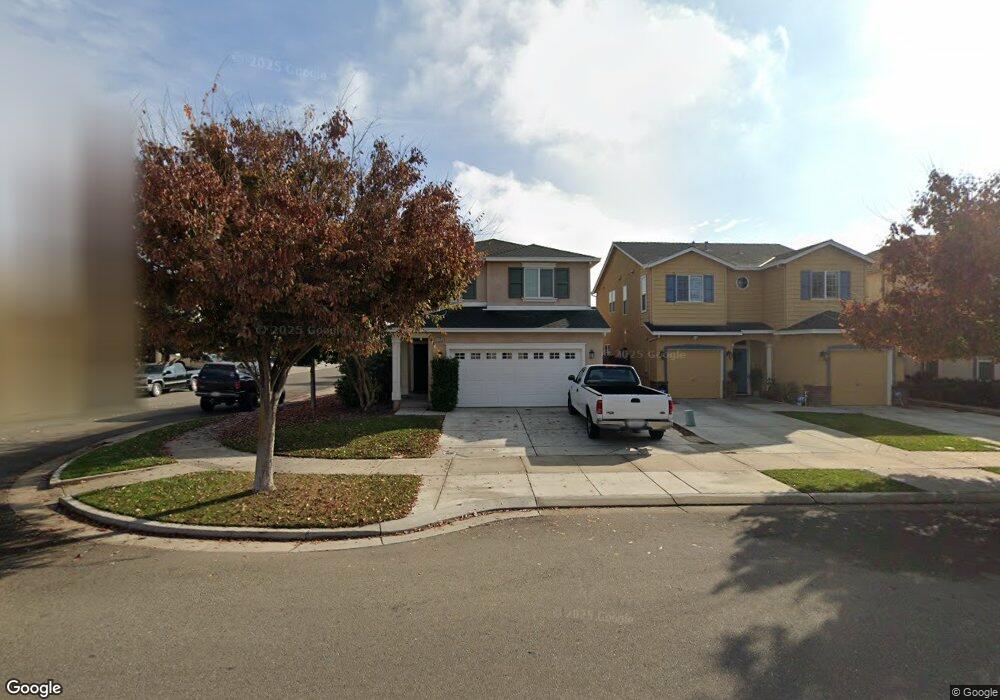
1510 Hearthsong Dr Manteca, CA 95337
Estimated Value: $473,377 - $523,000
3
Beds
3
Baths
1,283
Sq Ft
$391/Sq Ft
Est. Value
About This Home
This home is located at 1510 Hearthsong Dr, Manteca, CA 95337 and is currently estimated at $502,094, approximately $391 per square foot. 1510 Hearthsong Dr is a home located in San Joaquin County with nearby schools including Veritas Elementary School, Sierra High School, and BE.TECH Charter High School.
Ownership History
Date
Name
Owned For
Owner Type
Purchase Details
Closed on
Jun 21, 2016
Sold by
Silva Jose A
Bought by
Silva Jose A
Current Estimated Value
Home Financials for this Owner
Home Financials are based on the most recent Mortgage that was taken out on this home.
Original Mortgage
$167,885
Outstanding Balance
$134,396
Interest Rate
3.75%
Mortgage Type
FHA
Estimated Equity
$367,698
Purchase Details
Closed on
Mar 18, 2013
Sold by
Silva Iva M
Bought by
Silva Jose A
Purchase Details
Closed on
Dec 20, 2010
Sold by
Rose Petals Llc
Bought by
Silva Jose A and Silva Iva M
Home Financials for this Owner
Home Financials are based on the most recent Mortgage that was taken out on this home.
Original Mortgage
$179,910
Interest Rate
4.75%
Mortgage Type
FHA
Purchase Details
Closed on
Jan 25, 2010
Sold by
New A Holdings Llc
Bought by
Rose Petals Llc
Purchase Details
Closed on
Dec 23, 2008
Sold by
Rose Petals Llc
Bought by
New A Holdings Llc
Create a Home Valuation Report for This Property
The Home Valuation Report is an in-depth analysis detailing your home's value as well as a comparison with similar homes in the area
Purchase History
| Date | Buyer | Sale Price | Title Company |
|---|---|---|---|
| Silva Jose A | -- | Ticor Title San Diego Branch | |
| Silva Jose A | -- | None Available | |
| Silva Jose A | -- | Old Republic Title Company | |
| Rose Petals Llc | -- | Old Republic Title Company | |
| New A Holdings Llc | -- | Old Republic Title Company |
Source: Public Records
Mortgage History
| Date | Status | Borrower | Loan Amount |
|---|---|---|---|
| Open | Silva Jose A | $167,885 | |
| Closed | Silva Jose A | $179,910 |
Source: Public Records
Tax History
| Year | Tax Paid | Tax Assessment Tax Assessment Total Assessment is a certain percentage of the fair market value that is determined by local assessors to be the total taxable value of land and additions on the property. | Land | Improvement |
|---|---|---|---|---|
| 2025 | $3,585 | $236,479 | $58,928 | $177,551 |
| 2024 | $3,442 | $231,843 | $57,773 | $174,070 |
| 2023 | $3,366 | $227,298 | $56,641 | $170,657 |
| 2022 | $3,382 | $222,842 | $55,531 | $167,311 |
| 2021 | $3,353 | $218,474 | $54,443 | $164,031 |
| 2020 | $3,247 | $216,235 | $53,885 | $162,350 |
| 2019 | $3,186 | $211,996 | $52,829 | $159,167 |
| 2018 | $3,114 | $207,841 | $51,794 | $156,047 |
| 2017 | $3,066 | $203,767 | $50,779 | $152,988 |
| 2016 | $3,027 | $199,773 | $49,784 | $149,989 |
| 2015 | $2,999 | $196,773 | $49,036 | $147,737 |
| 2014 | $2,802 | $192,919 | $48,076 | $144,843 |
Source: Public Records
Map
Nearby Homes
- 1447 Summerwind Ln
- 1564 Mendenhall Ave
- 2809 Wrangell St
- 1602 Mendenhall Ave
- 1678 Image Dr
- 2447 Capri Ct
- 1768 Eagle River Ave
- 1759 Eagle River Ave
- 1792 Skagway Ave
- 2511 Zellerbach St
- 2905 Bering St
- 2503 Zellerbach St
- 2491 Zellerbach St
- 2463 Zellerbach St
- 2435 Zellerbach St
- 2919 Bering St
- 2933 Bering St
- 2466 Zellerbach St
- 2535 Sather St
- 2521 Sather St
- 1518 Hearthsong Dr
- 1526 Hearthsong Dr
- 1513 Topiary Dr
- 1494 Hearthsong Dr
- 1534 Hearthsong Dr
- 1527 Topiary Dr
- 2643 Balmy St
- 1488 Hearthsong Dr
- 1542 Hearthsong Dr
- 1511 Hearthsong Dr
- 2617 Balmy St
- 1503 Hearthsong Dr
- 1482 Hearthsong Dr
- 1543 Topiary Dr
- 1497 Hearthsong Dr
- 1550 Hearthsong Dr
- 2644 Greenleaf St
- 2597 Balmy Ct
- 1476 Hearthsong Dr
- 2582 Balmy Ct
Your Personal Tour Guide
Ask me questions while you tour the home.