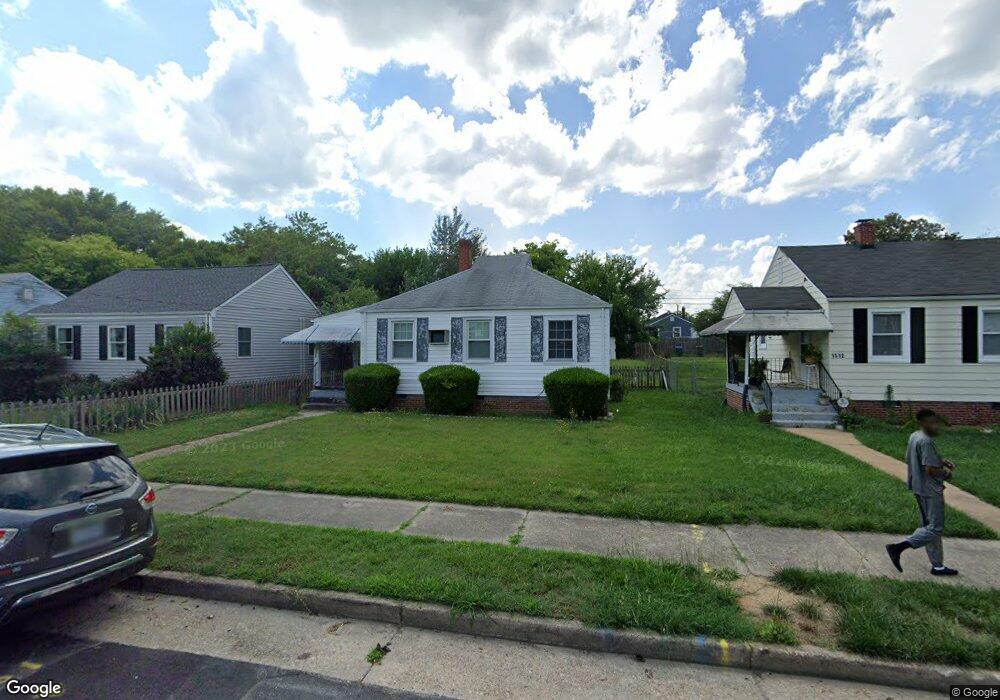
1510 N 30th St Richmond, VA 23223
Church Hill North NeighborhoodEstimated Value: $222,000 - $237,000
3
Beds
1
Bath
924
Sq Ft
$249/Sq Ft
Est. Value
About This Home
This home is located at 1510 N 30th St, Richmond, VA 23223 and is currently estimated at $229,667, approximately $248 per square foot. 1510 N 30th St is a home located in Richmond City with nearby schools including Henry L. Marsh, III Elementary School, Martin Luther King Jr. Middle School, and Armstrong High School.
Ownership History
Date
Name
Owned For
Owner Type
Purchase Details
Closed on
Sep 21, 2009
Sold by
Deutsche Bank National Trust
Bought by
Sheridan Bryan F
Current Estimated Value
Purchase Details
Closed on
Dec 19, 2006
Sold by
Friend George D
Bought by
Glover Michele C
Home Financials for this Owner
Home Financials are based on the most recent Mortgage that was taken out on this home.
Original Mortgage
$72,000
Interest Rate
6.14%
Mortgage Type
New Conventional
Create a Home Valuation Report for This Property
The Home Valuation Report is an in-depth analysis detailing your home's value as well as a comparison with similar homes in the area
Home Values in the Area
Average Home Value in this Area
Purchase History
| Date | Buyer | Sale Price | Title Company |
|---|---|---|---|
| Sheridan Bryan F | $31,000 | -- | |
| Glover Michele C | $90,000 | -- |
Source: Public Records
Mortgage History
| Date | Status | Borrower | Loan Amount |
|---|---|---|---|
| Previous Owner | Glover Michele C | $72,000 |
Source: Public Records
Tax History Compared to Growth
Tax History
| Year | Tax Paid | Tax Assessment Tax Assessment Total Assessment is a certain percentage of the fair market value that is determined by local assessors to be the total taxable value of land and additions on the property. | Land | Improvement |
|---|---|---|---|---|
| 2025 | $1,704 | $142,000 | $76,000 | $66,000 |
| 2024 | $1,584 | $132,000 | $69,000 | $63,000 |
| 2023 | $1,476 | $123,000 | $69,000 | $54,000 |
| 2022 | $1,164 | $97,000 | $46,000 | $51,000 |
| 2021 | $912 | $84,000 | $35,000 | $49,000 |
| 2020 | $912 | $76,000 | $25,000 | $51,000 |
| 2019 | $876 | $73,000 | $18,000 | $55,000 |
| 2018 | $828 | $69,000 | $18,000 | $51,000 |
| 2017 | $816 | $68,000 | $18,000 | $50,000 |
| 2016 | $816 | $68,000 | $18,000 | $50,000 |
| 2015 | $900 | $75,000 | $16,000 | $59,000 |
| 2014 | $900 | $75,000 | $16,000 | $59,000 |
Source: Public Records
Map
Nearby Homes