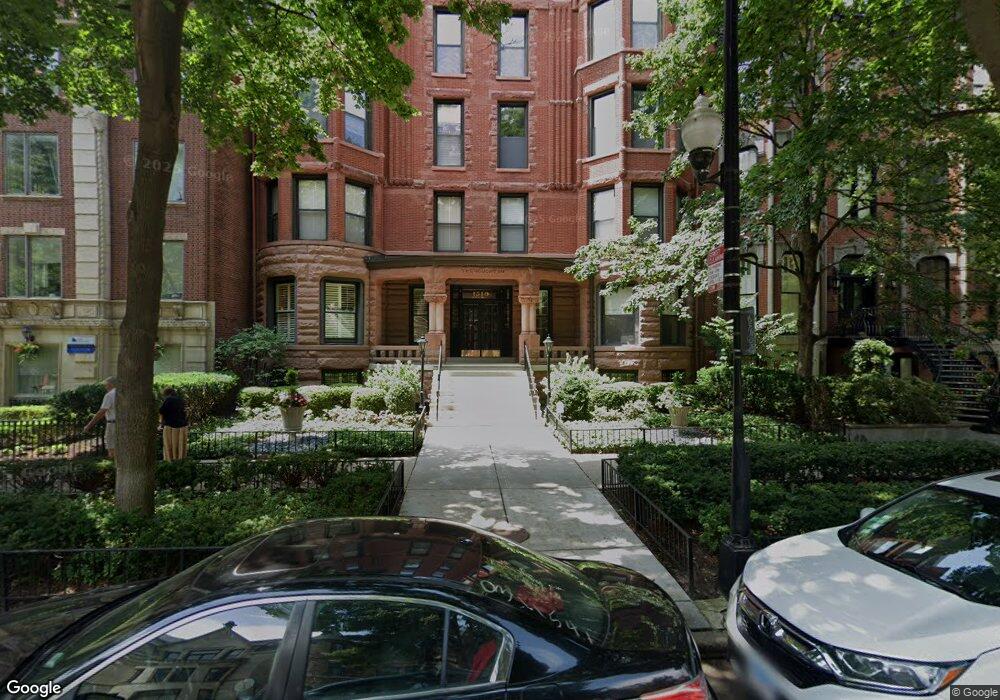
1510 N Dearborn Pkwy Unit PU4 Chicago, IL 60610
Gold Coast NeighborhoodEstimated Value: $131,000 - $735,648
--
Bed
--
Bath
--
Sq Ft
8,059
Sq Ft Lot
About This Home
This home is located at 1510 N Dearborn Pkwy Unit PU4, Chicago, IL 60610 and is currently estimated at $483,912. 1510 N Dearborn Pkwy Unit PU4 is a home located in Cook County with nearby schools including Ogden Elementary School, Lincoln Park High School, and The Latin School Of Chicago.
Ownership History
Date
Name
Owned For
Owner Type
Purchase Details
Closed on
Apr 18, 2024
Sold by
William A Russell Iii Trust and Russell William A
Bought by
Mazzolini John and Mazzolini Jennifer
Current Estimated Value
Home Financials for this Owner
Home Financials are based on the most recent Mortgage that was taken out on this home.
Original Mortgage
$675,750
Outstanding Balance
$665,881
Interest Rate
7%
Mortgage Type
New Conventional
Estimated Equity
-$181,969
Purchase Details
Closed on
Nov 1, 2016
Sold by
Russell William A and Russell Bridget A
Bought by
Russell William A and William A Russell Iii Trust
Purchase Details
Closed on
Apr 5, 1997
Sold by
Niewolny Dean D
Bought by
Skurnick Newman Brian L and Skurnick Newman Dana
Home Financials for this Owner
Home Financials are based on the most recent Mortgage that was taken out on this home.
Original Mortgage
$200,000
Interest Rate
7.25%
Create a Home Valuation Report for This Property
The Home Valuation Report is an in-depth analysis detailing your home's value as well as a comparison with similar homes in the area
Home Values in the Area
Average Home Value in this Area
Purchase History
| Date | Buyer | Sale Price | Title Company |
|---|---|---|---|
| Mazzolini John | $795,000 | None Listed On Document | |
| Russell William A | -- | None Available | |
| Skurnick Newman Brian L | $403,500 | 1St American Title |
Source: Public Records
Mortgage History
| Date | Status | Borrower | Loan Amount |
|---|---|---|---|
| Open | Mazzolini John | $675,750 | |
| Previous Owner | Skurnick Newman Brian L | $200,000 |
Source: Public Records
Tax History Compared to Growth
Tax History
| Year | Tax Paid | Tax Assessment Tax Assessment Total Assessment is a certain percentage of the fair market value that is determined by local assessors to be the total taxable value of land and additions on the property. | Land | Improvement |
|---|---|---|---|---|
| 2024 | $211 | $1,681 | $400 | $1,281 |
| 2023 | $205 | $1,000 | $322 | $678 |
| 2022 | $205 | $1,000 | $322 | $678 |
| 2021 | $201 | $999 | $321 | $678 |
| 2020 | $301 | $1,352 | $225 | $1,127 |
| 2019 | $295 | $1,467 | $225 | $1,242 |
| 2018 | $290 | $1,467 | $225 | $1,242 |
| 2017 | $265 | $1,233 | $180 | $1,053 |
| 2016 | $247 | $1,233 | $180 | $1,053 |
| 2015 | $226 | $1,233 | $180 | $1,053 |
| 2014 | $239 | $1,286 | $144 | $1,142 |
| 2013 | $234 | $1,286 | $144 | $1,142 |
Source: Public Records
Map
Nearby Homes
- 1510 N Dearborn Pkwy Unit 402
- 1454 N Dearborn St
- 1520 N Dearborn Pkwy
- 1438 N Dearborn St
- 1447 N Dearborn St Unit 3S
- 1447 N Dearborn St Unit 2S
- 1447 N Dearborn St Unit 1S
- 1447 N Dearborn St Unit 3N
- 1447 N Dearborn St Unit 2N
- 1447 N Dearborn St Unit 1N
- 1540 N Dearborn Pkwy
- 1516 N State Pkwy Unit 5D
- 1429 N Dearborn St Unit 2N
- 1550 N Clark St Unit 604
- 1550 N Clark St Unit 302
- 1550 N Clark St Unit 704
- 1555 N Dearborn Pkwy Unit 8C
- 1555 N Dearborn Pkwy Unit 10E-D
- 1455 N Sandburg Terrace Unit 2606B
- 1455 N Sandburg Terrace Unit 2901B
- 1510 N Dearborn Pkwy Unit 304
- 1510 N Dearborn Pkwy Unit PU2
- 1510 N Dearborn Pkwy Unit 102
- 1510 N Dearborn Pkwy Unit PU3
- 1510 N Dearborn Pkwy Unit PU1
- 1510 N Dearborn Pkwy Unit 302
- 1510 N Dearborn Pkwy Unit 301
- 1510 N Dearborn Pkwy Unit 403
- 1510 N Dearborn Pkwy Unit 104
- 1510 N Dearborn Pkwy Unit 204
- 1510 N Dearborn Pkwy Unit 103
- 1510 N Dearborn Pkwy Unit 201
- 1510 N Dearborn Pkwy Unit 101
- 1510 N Dearborn Pkwy Unit 404
- 1510 N Dearborn Pkwy Unit 501
- 1510 N Dearborn Pkwy Unit PU5
- 1510 N Dearborn Pkwy Unit 202
- 1510 N Dearborn Pkwy Unit 203
- 1510 N Dearborn Pkwy Unit 107
- 1510 N Dearborn St Unit 203