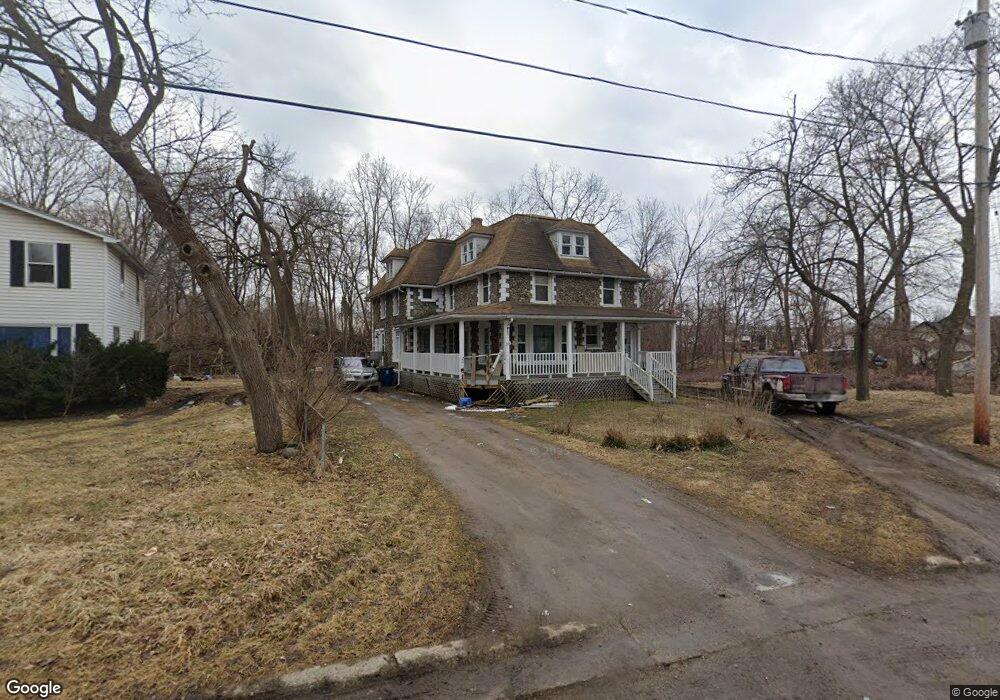
1510 Oak St Flint, MI 48503
South Side NeighborhoodEstimated Value: $77,130 - $103,000
--
Bed
4
Baths
2,296
Sq Ft
$38/Sq Ft
Est. Value
About This Home
This home is located at 1510 Oak St, Flint, MI 48503 and is currently estimated at $87,283, approximately $38 per square foot. 1510 Oak St is a home located in Genesee County with nearby schools including Freeman Elementary School, Flint Southwestern Classical Academy, and International Academy of Flint (K-12).
Ownership History
Date
Name
Owned For
Owner Type
Purchase Details
Closed on
Nov 20, 2018
Sold by
Miller Michael
Bought by
Miller Michael J
Current Estimated Value
Home Financials for this Owner
Home Financials are based on the most recent Mortgage that was taken out on this home.
Original Mortgage
$15,400
Outstanding Balance
$5,695
Interest Rate
4.8%
Mortgage Type
New Conventional
Estimated Equity
$81,588
Purchase Details
Closed on
Jul 28, 2017
Sold by
Young Pearl M
Bought by
Miller Michael
Create a Home Valuation Report for This Property
The Home Valuation Report is an in-depth analysis detailing your home's value as well as a comparison with similar homes in the area
Home Values in the Area
Average Home Value in this Area
Purchase History
| Date | Buyer | Sale Price | Title Company |
|---|---|---|---|
| Miller Michael J | -- | None Available | |
| Miller Michael | $8,000 | Cislo Title Co |
Source: Public Records
Mortgage History
| Date | Status | Borrower | Loan Amount |
|---|---|---|---|
| Open | Miller Michael J | $15,400 |
Source: Public Records
Tax History Compared to Growth
Tax History
| Year | Tax Paid | Tax Assessment Tax Assessment Total Assessment is a certain percentage of the fair market value that is determined by local assessors to be the total taxable value of land and additions on the property. | Land | Improvement |
|---|---|---|---|---|
| 2025 | $3,246 | $30,400 | $0 | $0 |
| 2024 | $3,018 | $33,200 | $0 | $0 |
| 2023 | $1,799 | $29,300 | $0 | $0 |
| 2022 | $0 | $20,700 | $0 | $0 |
| 2021 | $1,712 | $18,300 | $0 | $0 |
| 2020 | $1,611 | $17,000 | $0 | $0 |
| 2019 | $1,081 | $12,600 | $0 | $0 |
| 2018 | $1,559 | $12,700 | $0 | $0 |
| 2017 | $1,147 | $0 | $0 | $0 |
| 2016 | $1,143 | $0 | $0 | $0 |
| 2015 | -- | $0 | $0 | $0 |
| 2014 | -- | $0 | $0 | $0 |
| 2012 | -- | $9,300 | $0 | $0 |
Source: Public Records
Map
Nearby Homes