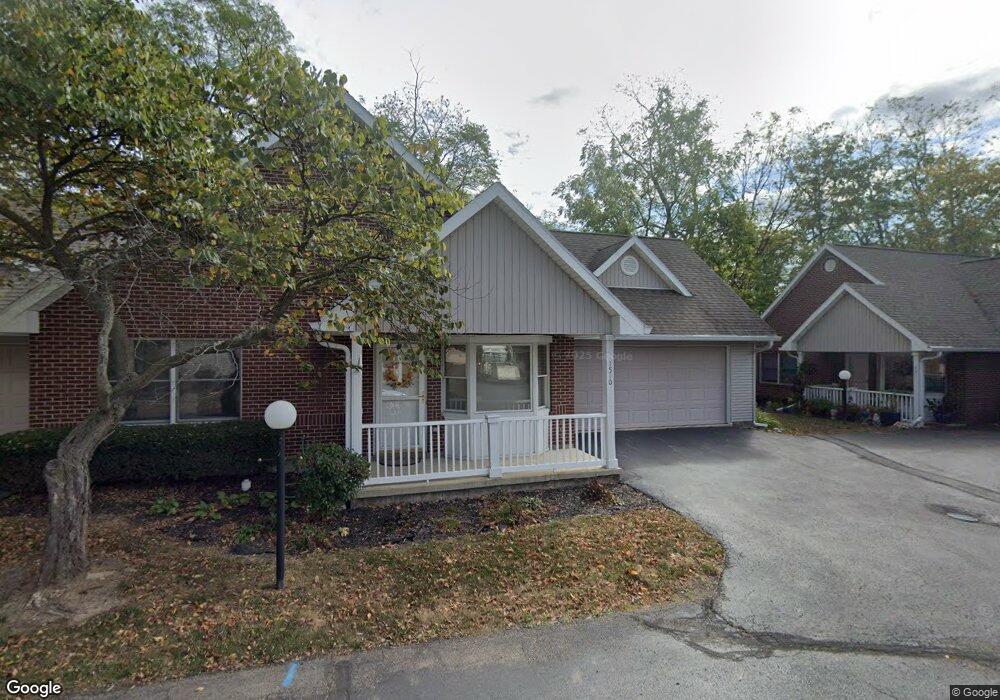
1510 Ridgeview Cir E Unit 11 Springfield, OH 45504
Estimated Value: $158,000 - $192,000
3
Beds
3
Baths
1,596
Sq Ft
$109/Sq Ft
Est. Value
About This Home
This home is located at 1510 Ridgeview Cir E Unit 11, Springfield, OH 45504 and is currently estimated at $174,619, approximately $109 per square foot. 1510 Ridgeview Cir E Unit 11 is a home located in Clark County with nearby schools including Snowhill Elementary School, Roosevelt Middle School, and Springfield High School.
Ownership History
Date
Name
Owned For
Owner Type
Purchase Details
Closed on
Jun 23, 2022
Sold by
Barbara A Barth Trust
Bought by
Wilson Kristina L
Current Estimated Value
Purchase Details
Closed on
Mar 3, 2000
Sold by
Icon Inc
Bought by
Chepp Jean M
Home Financials for this Owner
Home Financials are based on the most recent Mortgage that was taken out on this home.
Original Mortgage
$107,832
Interest Rate
8.27%
Create a Home Valuation Report for This Property
The Home Valuation Report is an in-depth analysis detailing your home's value as well as a comparison with similar homes in the area
Home Values in the Area
Average Home Value in this Area
Purchase History
| Date | Buyer | Sale Price | Title Company |
|---|---|---|---|
| Wilson Kristina L | -- | Noll Benjamin D | |
| Wilson Kristina L | -- | None Listed On Document | |
| Chepp Jean M | $134,800 | -- |
Source: Public Records
Mortgage History
| Date | Status | Borrower | Loan Amount |
|---|---|---|---|
| Previous Owner | Chepp Jean M | $107,832 |
Source: Public Records
Tax History
| Year | Tax Paid | Tax Assessment Tax Assessment Total Assessment is a certain percentage of the fair market value that is determined by local assessors to be the total taxable value of land and additions on the property. | Land | Improvement |
|---|---|---|---|---|
| 2025 | $2,510 | $63,010 | $7,350 | $55,660 |
| 2024 | $3,684 | $49,520 | $6,830 | $42,690 |
| 2023 | $3,684 | $49,520 | $6,830 | $42,690 |
| 2022 | $2,113 | $49,520 | $6,830 | $42,690 |
| 2021 | $1,505 | $36,890 | $5,250 | $31,640 |
| 2020 | $1,508 | $36,890 | $5,250 | $31,640 |
| 2019 | $1,512 | $36,890 | $5,250 | $31,640 |
| 2018 | $1,594 | $37,250 | $5,250 | $32,000 |
| 2017 | $1,593 | $37,650 | $5,250 | $32,400 |
| 2016 | $1,595 | $37,650 | $5,250 | $32,400 |
| 2015 | $1,542 | $37,650 | $5,250 | $32,400 |
| 2014 | $1,536 | $37,650 | $5,250 | $32,400 |
| 2013 | $1,519 | $37,650 | $5,250 | $32,400 |
Source: Public Records
Map
Nearby Homes
- 648 N Tanglewood Dr
- 125 Hawthorne Rd
- 735 Tanglewood Dr
- 1425 Sheaff Rd
- 327 Ardmore Rd
- 820 W 1st St
- 827 Snowhill Blvd
- 0 E McCreight Ave
- 25 Englewood Rd
- 1330 Garfield Ave
- 1329 Lamar Dr
- 1107 N Fountain Ave
- 24 Bill Edwards Dr
- 110 S Broadmoor Blvd
- 1023 Garfield Ave
- 119 E McCreight Ave
- 154 Floral Ave
- 1810 N Limestone St
- 1007 N Limestone St
- 120 E Ward St
- 1510 Ridgeview Cir E
- 1512 Ridgeview Cir E
- 471 Ridgeview Cir S Unit 12
- 473 Ridgeview Cir S
- 1514 Ridgeview Cir E Unit 9
- 476 Ridgeview Cir S Unit 7
- 1516 Ridgeview Cr
- 475 Ridgeview Cir S Unit 14
- 1505 N Plum St
- 1515 N Plum St Unit E
- 1515 N Plum St Unit C
- 1515 N Plum St Unit d
- 1516 Ridgeview Cir E Unit 8
- 483 Ridgeview Cir N Unit 5
- 478 Ridgeview Cir S
- 478 Ridgeview Cir S Unit 6
- 478 Ridgeview Cir S
- 1511 N Plum St Unit C
- 1511 N Plum St Unit B
- 1511 N Plum St Unit D
Your Personal Tour Guide
Ask me questions while you tour the home.