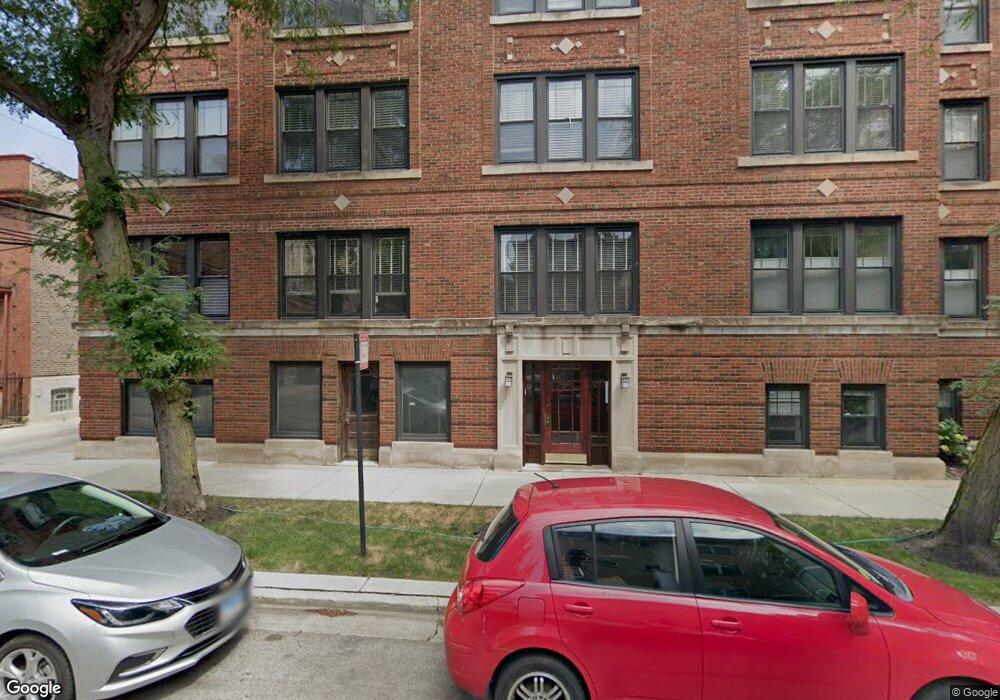
1510 W Cullom Ave Unit 1510 Chicago, IL 60613
Graceland West NeighborhoodEstimated Value: $566,000 - $691,000
3
Beds
2
Baths
24,080
Sq Ft
$26/Sq Ft
Est. Value
About This Home
This home is located at 1510 W Cullom Ave Unit 1510, Chicago, IL 60613 and is currently estimated at $618,306, approximately $25 per square foot. 1510 W Cullom Ave Unit 1510 is a home located in Cook County with nearby schools including Ravenswood Elementary School, Lake View High School, and Chicago Montessori School.
Ownership History
Date
Name
Owned For
Owner Type
Purchase Details
Closed on
May 16, 2023
Sold by
Clark Fraser and Clark Dale
Bought by
Haberek Noel Basil and Haberek Mary Patrice
Current Estimated Value
Home Financials for this Owner
Home Financials are based on the most recent Mortgage that was taken out on this home.
Original Mortgage
$458,915
Outstanding Balance
$448,291
Interest Rate
7.38%
Mortgage Type
New Conventional
Estimated Equity
$170,015
Purchase Details
Closed on
Jun 21, 2013
Sold by
Lozier Chris S and Kaplan Monisha G
Bought by
Clark Fraser
Home Financials for this Owner
Home Financials are based on the most recent Mortgage that was taken out on this home.
Original Mortgage
$244,200
Interest Rate
3.5%
Mortgage Type
New Conventional
Create a Home Valuation Report for This Property
The Home Valuation Report is an in-depth analysis detailing your home's value as well as a comparison with similar homes in the area
Home Values in the Area
Average Home Value in this Area
Purchase History
| Date | Buyer | Sale Price | Title Company |
|---|---|---|---|
| Haberek Noel Basil | $540,000 | Proper Title | |
| Clark Fraser | $407,000 | Multiple |
Source: Public Records
Mortgage History
| Date | Status | Borrower | Loan Amount |
|---|---|---|---|
| Open | Haberek Noel Basil | $458,915 | |
| Previous Owner | Clark Fraser | $244,200 |
Source: Public Records
Tax History Compared to Growth
Tax History
| Year | Tax Paid | Tax Assessment Tax Assessment Total Assessment is a certain percentage of the fair market value that is determined by local assessors to be the total taxable value of land and additions on the property. | Land | Improvement |
|---|---|---|---|---|
| 2024 | $8,795 | $48,793 | $7,397 | $41,396 |
| 2023 | $8,552 | $45,000 | $5,947 | $39,053 |
| 2022 | $8,552 | $45,000 | $5,947 | $39,053 |
| 2021 | $8,379 | $44,999 | $5,947 | $39,052 |
| 2020 | $7,759 | $37,930 | $3,568 | $34,362 |
| 2019 | $7,717 | $41,839 | $3,568 | $38,271 |
| 2018 | $7,586 | $41,839 | $3,568 | $38,271 |
| 2017 | $7,053 | $36,138 | $3,122 | $33,016 |
| 2016 | $6,738 | $36,138 | $3,122 | $33,016 |
| 2015 | $6,141 | $36,138 | $3,122 | $33,016 |
| 2014 | $5,431 | $31,841 | $2,397 | $29,444 |
| 2013 | $5,313 | $31,841 | $2,397 | $29,444 |
Source: Public Records
Map
Nearby Homes
- 4244 N Ashland Ave
- 1441 W Cullom Ave
- 4313 N Paulina St Unit 43133
- 1510 W Montrose Ave
- 4415 N Ashland Ave
- 4422 N Ashland Ave Unit G
- 1416 W Warner Ave
- 4444 N Greenview Ave
- 1446 W Belle Plaine Ave
- 4153 N Hermitage Ave
- 1410 W Sunnyside Ave Unit 1S
- 4449 N Beacon St Unit 1N
- 1431 W Cuyler Ave Unit 1S
- 4537 N Greenview Ave
- 1442 W Irving Park Rd
- 1426 W Irving Park Rd Unit 4
- 1511 W Irving Park Rd Unit 1W
- 4243 N Wolcott Ave
- 1522 W Wilson Ave
- 4305 N Wolcott Ave
- 1510 W Cullom Ave Unit 1510
- 1510 W Cullom Ave Unit 1510
- 1510 W Cullom Ave Unit D1
- 1510 W Cullom Ave Unit D3
- 1508 W Cullom Ave Unit 1508
- 1508 W Cullom Ave Unit 1508
- 1508 W Cullom Ave Unit 1508
- 1508 W Cullom Ave Unit 1508
- 1508 W Cullom Ave Unit C-G
- 1508 W Cullom Ave Unit 2C
- 1508 W Cullom Ave Unit 1
- 1508 W Cullom Ave Unit 3C
- 1504 W Cullom Ave Unit 1504
- 1506 W Cullom Ave Unit 1506
- 1504 W Cullom Ave Unit 1504
- 1506 W Cullom Ave Unit 1506
- 1506 W Cullom Ave Unit 1506
- 1504 W Cullom Ave Unit 1504
- 1504 W Cullom Ave Unit 1504
- 1506 W Cullom Ave Unit B-1