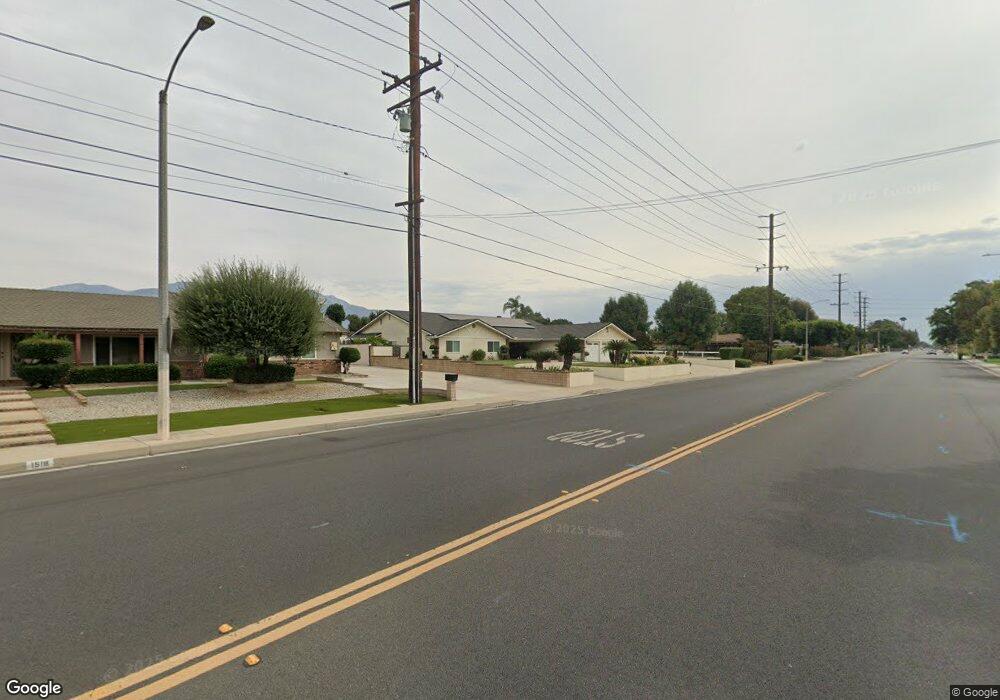
1510 W Phillips St Ontario, CA 91762
Downtown Ontario NeighborhoodEstimated Value: $1,125,371 - $1,520,000
4
Beds
3
Baths
2,978
Sq Ft
$435/Sq Ft
Est. Value
About This Home
This home is located at 1510 W Phillips St, Ontario, CA 91762 and is currently estimated at $1,295,343, approximately $434 per square foot. 1510 W Phillips St is a home located in San Bernardino County with nearby schools including Mission Elementary School, Oaks Middle, and Ontario High School.
Ownership History
Date
Name
Owned For
Owner Type
Purchase Details
Closed on
Sep 28, 2021
Sold by
Deaver Steven E and Deaver Linda Stiner
Bought by
Deaver Steven E and Deaver Linda S
Current Estimated Value
Purchase Details
Closed on
May 13, 2005
Sold by
Deaver Steven E
Bought by
Deaver Steven E and Deaver Linda Stiner
Purchase Details
Closed on
Jan 31, 1996
Sold by
Deaver Steve
Bought by
Deaver Steven E and Stiner Deaver Linda
Home Financials for this Owner
Home Financials are based on the most recent Mortgage that was taken out on this home.
Original Mortgage
$228,800
Interest Rate
7.18%
Purchase Details
Closed on
Dec 6, 1995
Sold by
Alberto Antonio
Bought by
Deaver Steve and Deaver Linda
Home Financials for this Owner
Home Financials are based on the most recent Mortgage that was taken out on this home.
Original Mortgage
$228,800
Interest Rate
7.18%
Create a Home Valuation Report for This Property
The Home Valuation Report is an in-depth analysis detailing your home's value as well as a comparison with similar homes in the area
Home Values in the Area
Average Home Value in this Area
Purchase History
| Date | Buyer | Sale Price | Title Company |
|---|---|---|---|
| Deaver Steven E | -- | Accommodation | |
| Deaver Steven E | -- | -- | |
| Marino Teri | -- | -- | |
| Deaver Steven E | -- | -- | |
| Deaver Steve | $286,000 | Chicago Title Co |
Source: Public Records
Mortgage History
| Date | Status | Borrower | Loan Amount |
|---|---|---|---|
| Previous Owner | Deaver Steve | $228,800 |
Source: Public Records
Tax History Compared to Growth
Tax History
| Year | Tax Paid | Tax Assessment Tax Assessment Total Assessment is a certain percentage of the fair market value that is determined by local assessors to be the total taxable value of land and additions on the property. | Land | Improvement |
|---|---|---|---|---|
| 2025 | $5,454 | $507,688 | $124,594 | $383,094 |
| 2024 | $5,454 | $497,733 | $122,151 | $375,582 |
| 2023 | $5,301 | $487,974 | $119,756 | $368,218 |
| 2022 | $5,231 | $478,406 | $117,408 | $360,998 |
| 2021 | $5,122 | $469,026 | $115,106 | $353,920 |
| 2020 | $5,031 | $464,217 | $113,926 | $350,291 |
| 2019 | $4,986 | $455,115 | $111,692 | $343,423 |
| 2018 | $4,916 | $446,191 | $109,502 | $336,689 |
| 2017 | $4,738 | $437,442 | $107,355 | $330,087 |
| 2016 | $4,549 | $428,865 | $105,250 | $323,615 |
| 2015 | $4,518 | $422,423 | $103,669 | $318,754 |
| 2014 | $4,376 | $414,148 | $101,638 | $312,510 |
Source: Public Records
Map
Nearby Homes
- 1325 W Ralston St
- 5525 Dover St
- 1511 W Mission Blvd
- 1411 W Mission Blvd
- 1007 S Magnolia Ave
- 890 S Magnolia Ave
- 1604 S Mountain Ave Unit D
- 1020 S Mountain Ave
- 1309 W Mission Blvd Unit 28
- 1309 W Mission Blvd Unit 59
- 1309 W Mission Blvd
- 906 S Mountain Ave Unit A
- 11155 S Central Ave
- 11145 S Central Ave
- 1712 S Mountain Ave Unit E
- 1726 S Mountain Ave Unit C
- 1706 S Mountain Ave
- 5500 Francis Ave
- 831 S Mountain Ave Unit 6
- 829 S Mountain Ave
- 1029 S Helen Ave
- 1518 W Phillips St
- 1290 S Almond Ave
- 1284 S Almond Ave
- 1530 W Phillips St
- 1274 S Almond Ave
- 1407 S Helen Ave
- 1268 S Almond Ave
- 1439 W Phillips St
- 1542 W Phillips St
- 1412 S Helen Ave
- 1415 S Helen Ave
- 1258 S Almond Ave
- 1427 W Phillips St
- 1315 S Jasmine Ave
- 1409 S Jasmine Ave
- 1291 S Almond Ave
- 1281 S Almond Ave
- 1420 S Helen Ave
- 1273 S Almond Ave