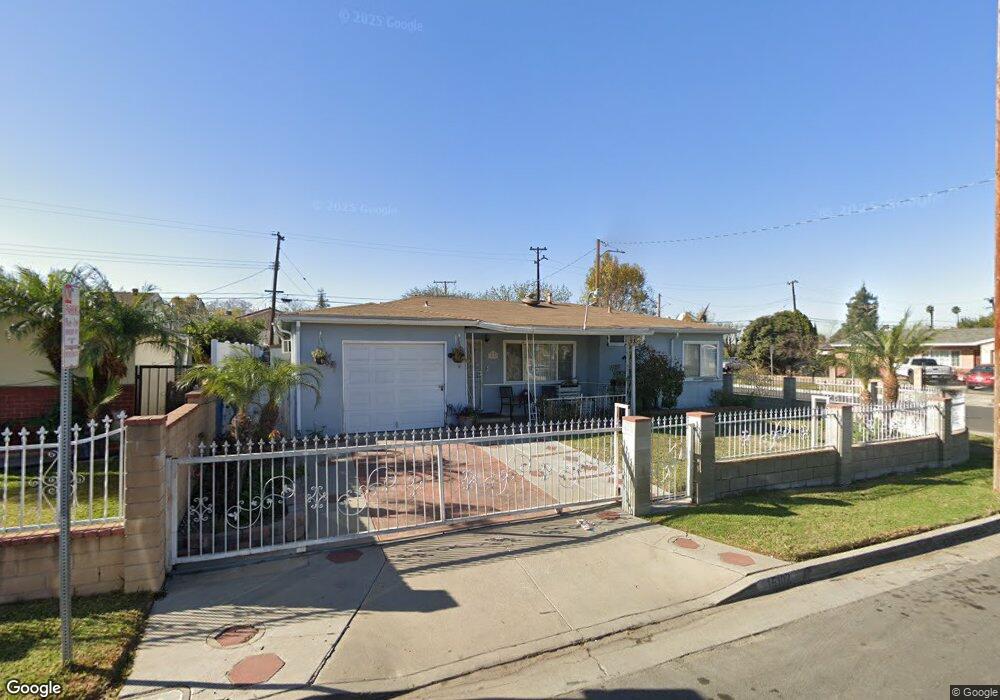
15102 Ragus St La Puente, CA 91744
West Puente Valley NeighborhoodEstimated Value: $680,976 - $731,000
3
Beds
1
Bath
956
Sq Ft
$734/Sq Ft
Est. Value
About This Home
This home is located at 15102 Ragus St, La Puente, CA 91744 and is currently estimated at $701,994, approximately $734 per square foot. 15102 Ragus St is a home located in Los Angeles County with nearby schools including Sparks Middle School, La Puente High School, and New Montessori School.
Ownership History
Date
Name
Owned For
Owner Type
Purchase Details
Closed on
Feb 15, 2018
Sold by
Rejon Rosario C
Bought by
Rejon Marilyn
Current Estimated Value
Purchase Details
Closed on
Aug 15, 2013
Sold by
Rejon Marilyn
Bought by
Rejon Rosario C
Purchase Details
Closed on
Apr 8, 2005
Sold by
Rejon Rosario C
Bought by
Rejon Rosario C and Rejon Marilyn
Home Financials for this Owner
Home Financials are based on the most recent Mortgage that was taken out on this home.
Original Mortgage
$141,400
Interest Rate
5.84%
Mortgage Type
New Conventional
Purchase Details
Closed on
Sep 28, 2000
Sold by
Rejon Marilyn
Bought by
Rejon Rosario C
Purchase Details
Closed on
Sep 16, 1998
Sold by
Rejon Rosario C
Bought by
Rejon Marilyn and Rejon Agustin R
Home Financials for this Owner
Home Financials are based on the most recent Mortgage that was taken out on this home.
Original Mortgage
$126,360
Interest Rate
6.88%
Mortgage Type
FHA
Create a Home Valuation Report for This Property
The Home Valuation Report is an in-depth analysis detailing your home's value as well as a comparison with similar homes in the area
Home Values in the Area
Average Home Value in this Area
Purchase History
| Date | Buyer | Sale Price | Title Company |
|---|---|---|---|
| Rejon Marilyn | -- | None Available | |
| Rejon Rosario C | -- | None Available | |
| Rejon Rosario C | -- | -- | |
| Rejon Rosario C | -- | -- | |
| Rejon Marilyn | -- | United Title Company |
Source: Public Records
Mortgage History
| Date | Status | Borrower | Loan Amount |
|---|---|---|---|
| Closed | Rejon Rosario C | $141,400 | |
| Previous Owner | Rejon Marilyn | $126,360 |
Source: Public Records
Tax History
| Year | Tax Paid | Tax Assessment Tax Assessment Total Assessment is a certain percentage of the fair market value that is determined by local assessors to be the total taxable value of land and additions on the property. | Land | Improvement |
|---|---|---|---|---|
| 2025 | $4,972 | $398,236 | $261,699 | $136,537 |
| 2024 | $4,972 | $390,428 | $256,568 | $133,860 |
| 2023 | $4,844 | $382,774 | $251,538 | $131,236 |
| 2022 | $4,702 | $375,269 | $246,606 | $128,663 |
| 2021 | $4,618 | $367,912 | $241,771 | $126,141 |
| 2019 | $4,485 | $357,000 | $234,600 | $122,400 |
| 2018 | $2,644 | $194,657 | $116,532 | $78,125 |
| 2016 | $2,456 | $187,101 | $112,008 | $75,093 |
| 2015 | $2,411 | $184,292 | $110,326 | $73,966 |
| 2014 | $2,378 | $180,683 | $108,165 | $72,518 |
Source: Public Records
Map
Nearby Homes
- 1133 Aldgate Ave
- 15426 Hayland St
- 1023 Gilwood Ave
- 1084 Del Valle Ave
- 1420 Glenshaw Dr
- 1069 Aileron Ave
- 826 Del Valle Ave
- 844 Larimore Ave
- 15704 Francisquito Ave
- 14641 Lassalette St
- 15865 Sierra Vista Ct
- 611 Santo Oro Ave
- 14612 Hutchcroft St
- 1528 W Delvale St
- 15925 Amar Rd
- 1020 League Ave
- 15937 Amar Rd
- 15943 Amar Rd
- 15947 Amar Rd
- 338 E Michelle St
- 15108 Ragus St
- 1038 Aldgate Ave
- 15114 Ragus St
- 1036 Aldgate Ave
- 15103 Ragus St
- 1049 Aldgate Ave
- 15109 Ragus St
- 1055 Aldgate Ave
- 15120 Ragus St
- 15115 Ragus St
- 1030 Aldgate Ave Unit Large studio room
- 1030 Aldgate Ave
- 1059 Aldgate Ave
- 1031 Aldgate Ave
- 15121 Ragus St
- 1065 Aldgate Ave
- 15126 Ragus St
- 15040 Hayland St
- 1102 Egan Ave
- 1048 Melham Ave
Your Personal Tour Guide
Ask me questions while you tour the home.