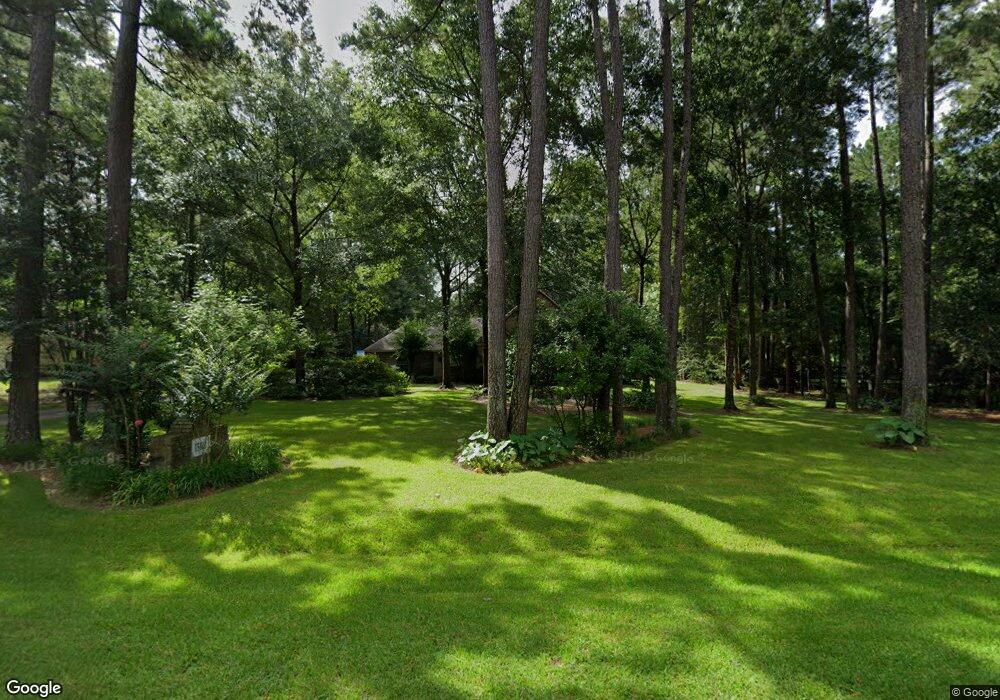
15103 Timbershire Ct Magnolia, TX 77355
Estimated Value: $559,902 - $783,000
--
Bed
3
Baths
2,472
Sq Ft
$266/Sq Ft
Est. Value
About This Home
This home is located at 15103 Timbershire Ct, Magnolia, TX 77355 and is currently estimated at $658,226, approximately $266 per square foot. 15103 Timbershire Ct is a home located in Montgomery County with nearby schools including J.L. Lyon Elementary School, Magnolia Sixth Grade Campus, and Magnolia Junior High School.
Ownership History
Date
Name
Owned For
Owner Type
Purchase Details
Closed on
Jun 19, 2003
Sold by
Vecchio Robert Louis and Vecchio Kathryn I
Bought by
Vecchio Robert Louis and Vecchio Kathryn I
Current Estimated Value
Purchase Details
Closed on
Apr 25, 2000
Sold by
Parkstone Development Corp
Bought by
Vecchio Robert L and Vecchio Kathryn I
Home Financials for this Owner
Home Financials are based on the most recent Mortgage that was taken out on this home.
Original Mortgage
$150,000
Outstanding Balance
$52,082
Interest Rate
8.21%
Estimated Equity
$606,144
Purchase Details
Closed on
Nov 16, 1999
Sold by
Jack Frey Properties Inc
Bought by
Parkstone Development Corp and Parkstone Estate Homes
Home Financials for this Owner
Home Financials are based on the most recent Mortgage that was taken out on this home.
Original Mortgage
$175,992
Interest Rate
7.88%
Create a Home Valuation Report for This Property
The Home Valuation Report is an in-depth analysis detailing your home's value as well as a comparison with similar homes in the area
Home Values in the Area
Average Home Value in this Area
Purchase History
| Date | Buyer | Sale Price | Title Company |
|---|---|---|---|
| Vecchio Robert Louis | -- | -- | |
| Vecchio Robert L | -- | Texas American Title Company | |
| Parkstone Development Corp | -- | Texas American Title Company |
Source: Public Records
Mortgage History
| Date | Status | Borrower | Loan Amount |
|---|---|---|---|
| Open | Vecchio Robert L | $150,000 | |
| Previous Owner | Parkstone Development Corp | $175,992 |
Source: Public Records
Tax History Compared to Growth
Tax History
| Year | Tax Paid | Tax Assessment Tax Assessment Total Assessment is a certain percentage of the fair market value that is determined by local assessors to be the total taxable value of land and additions on the property. | Land | Improvement |
|---|---|---|---|---|
| 2025 | $2,747 | $549,159 | -- | -- |
| 2024 | $2,707 | $499,235 | -- | -- |
| 2023 | $2,707 | $453,850 | $107,450 | $435,320 |
| 2022 | $7,281 | $412,590 | $108,140 | $418,640 |
| 2021 | $6,972 | $375,080 | $81,270 | $293,810 |
| 2020 | $7,716 | $381,260 | $81,270 | $299,990 |
| 2019 | $7,226 | $358,800 | $81,270 | $277,530 |
| 2018 | $6,225 | $349,620 | $60,000 | $289,620 |
| 2017 | $6,984 | $329,360 | $60,000 | $302,970 |
| 2016 | $6,349 | $299,420 | $60,000 | $239,420 |
| 2015 | $4,736 | $297,780 | $60,000 | $239,420 |
| 2014 | $4,736 | $270,710 | $60,000 | $222,360 |
Source: Public Records
Map
Nearby Homes
- 15019 Timbershire Ct
- 603 Terri Ln
- 15937 Stagecoach Rd
- 15823 Stagecoach Rd
- 2102 Candy St
- 15245 Shady Oaks Dr
- 15450 Shady Oaks Dr
- 14810 Timberleaf Dr
- TBD Cimmaron Dr
- 2103 Diane St
- TBD Stagecoach Rd
- 16633 Cimmaron Dr
- 0 Boothill Rd Unit 38015944
- 0 Frontier Rd
- 1219 Coe Rd
- 14419 Timbergreen Dr
- 1046 Goodson Loop Unit 1
- 669 Platinum Stone Ln
- 522 Whispering Meadow
- 1426 Northwood Bluff Ln
- 15111 Timbershire Ct
- 15035 Timbershire Ct
- 15102 Timbershire Ct
- 15119 Timbershire Ct
- 15027 Timbershire Ct
- 15026 Timbershade Crossing
- 15034 Timbershire Ct
- 15018 Timbershade Crossing
- 15110 Timbershire Ct
- 15102 Timbershade Crossing
- 15110 Timbershade Crossing
- 15127 Timbershire Ct
- 15118 Timbershire Ct
- 0 Timbershade Crossing
- 15026 Timbershire Ct
- Lot 28 Timbershire
- 15118 Timbershade Crossing
- 15126 Timbershire Ct
- 0 Timbershire Ct
- 15010 Timbershade Crossing