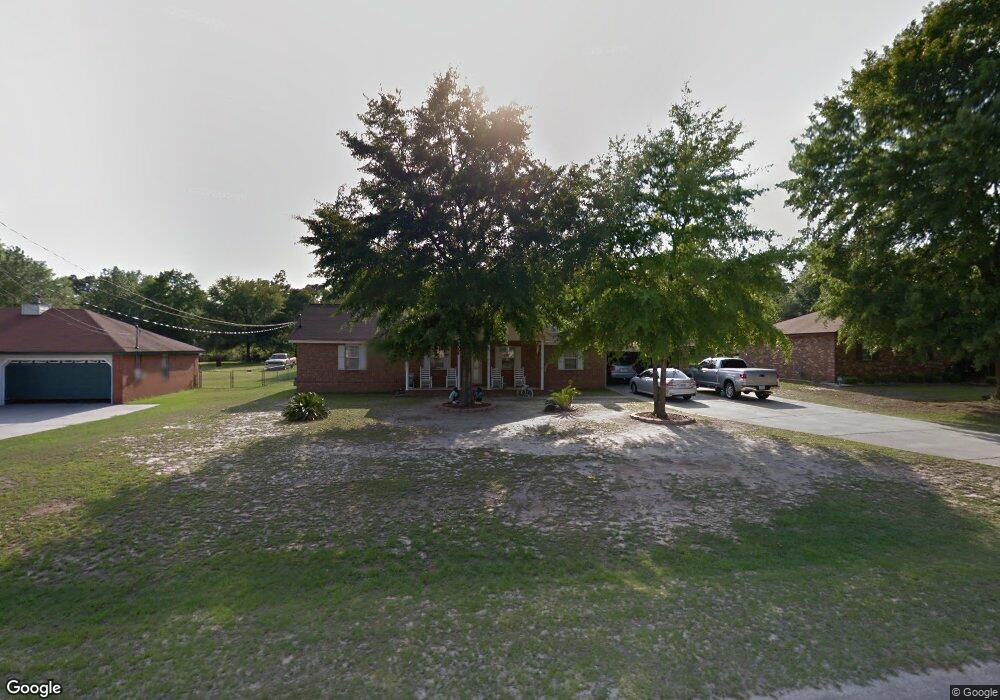
1510E Pine Ridge Dr E Hephzibah, GA 30815
McBean NeighborhoodEstimated Value: $221,000 - $258,000
3
Beds
2
Baths
1,623
Sq Ft
$150/Sq Ft
Est. Value
About This Home
This home is located at 1510E Pine Ridge Dr E, Hephzibah, GA 30815 and is currently estimated at $242,679, approximately $149 per square foot. 1510E Pine Ridge Dr E is a home located in Richmond County with nearby schools including McBean Elementary School, Pine Hill Middle School, and Johnson Magnet.
Ownership History
Date
Name
Owned For
Owner Type
Purchase Details
Closed on
Aug 1, 2002
Sold by
Hud
Bought by
Prince Michael R and Prince Georgia
Current Estimated Value
Home Financials for this Owner
Home Financials are based on the most recent Mortgage that was taken out on this home.
Original Mortgage
$90,480
Outstanding Balance
$36,730
Interest Rate
6.52%
Mortgage Type
FHA
Estimated Equity
$205,949
Purchase Details
Closed on
Mar 5, 2002
Sold by
Ba Mtg Llc
Bought by
Hud
Purchase Details
Closed on
May 24, 1996
Sold by
Mccumbers Builders
Bought by
Cole Charlsie M
Purchase Details
Closed on
Mar 23, 1995
Sold by
Mccumbers Kenneth Mc Cumbers Kenneth
Bought by
Mccumbers Builders Inc Mc Cumbers Build
Purchase Details
Closed on
Dec 7, 1993
Sold by
Mccumbers Kenneth
Bought by
Mccumbers Builders
Purchase Details
Closed on
Sep 21, 1993
Sold by
Mccumbers Kenneth
Bought by
Mccumbers Kenneth
Purchase Details
Closed on
Nov 24, 1992
Sold by
Cedar Ridge Farms Inc Village Square L
Bought by
Mccumbers Kenneth
Create a Home Valuation Report for This Property
The Home Valuation Report is an in-depth analysis detailing your home's value as well as a comparison with similar homes in the area
Home Values in the Area
Average Home Value in this Area
Purchase History
We collect this data history from publicly available records. To have your information removed, we recommend requesting removal directly through your county’s website.
| Date | Buyer | Sale Price | Title Company |
|---|---|---|---|
| Prince Michael R | -- | -- | |
| Prince Michael R | -- | -- | |
| Hud | -- | -- | |
| Ba Mtg Llc | $85,296 | -- | |
| Ba Mortgage Llc | $85,300 | -- | |
| Cole Charlsie M | $87,400 | -- | |
| Mccumbers Builders Inc Mc Cumbers Build | -- | -- | |
| Mccumbers Builders | $228,000 | -- | |
| Mccumbers Kenneth | -- | -- | |
| Mccumbers Kenneth | -- | -- |
Source: Public Records
Mortgage History
We collect this data history from publicly available records. To have your information removed, we recommend requesting removal directly through your county’s website.
| Date | Status | Borrower | Loan Amount |
|---|---|---|---|
| Open | Prince Michael R | $90,480 |
Source: Public Records
Tax History
| Year | Tax Paid | Tax Assessment Tax Assessment Total Assessment is a certain percentage of the fair market value that is determined by local assessors to be the total taxable value of land and additions on the property. | Land | Improvement |
|---|---|---|---|---|
| 2025 | $2,837 | $93,108 | $8,800 | $84,308 |
| 2024 | $2,837 | $88,284 | $8,800 | $79,484 |
| 2023 | $1,737 | $75,988 | $8,800 | $67,188 |
| 2022 | $2,104 | $66,014 | $8,800 | $57,214 |
| 2021 | $1,695 | $47,274 | $8,800 | $38,474 |
| 2020 | $1,670 | $47,274 | $8,800 | $38,474 |
| 2019 | $1,763 | $47,274 | $8,800 | $38,474 |
| 2018 | $1,775 | $47,274 | $8,800 | $38,474 |
| 2017 | $1,724 | $47,274 | $8,800 | $38,474 |
| 2016 | $1,725 | $47,274 | $8,800 | $38,474 |
| 2015 | $1,736 | $47,274 | $8,800 | $38,474 |
| 2014 | $1,739 | $47,274 | $8,800 | $38,474 |
Source: Public Records
Map
Nearby Homes
- 4218 Cedar Ridge Dr N
- 4362 Big Dipper Cir
- 1073 Woodberry Dr
- 1621 N Pine Ridge Dr
- 4202 Cedarwood Dr
- 1704 Pitchwood Way
- 1727 Pine Ridge Dr N
- 1660 Pine Ridge Dr N
- 1716 Pine Ridge Dr N
- 1712 Pine Ridge Dr N
- 1687 Pine Ridge Dr N
- 1690 Pine Ridge Dr N
- 1707 Pine Ridge Dr N
- 1703 Pine Ridge Dr N
- 1683 Pine Ridge Dr N
- 4370 Forest Rd
- 1695 Pine Ridge Dr N
- 5213 Woodridge Dr
- 1576 Citation Rd
- 4064 Fairlane Ct
- 1508E Pine Ridge Dr E
- 1512E Pine Ridge Dr E
- 1512 Pine Ridge Dr E
- 1506 Pine Ridge Dr E
- 1506E Pine Ridge Dr E
- 1514 Pine Ridge Dr E
- 1517 Pine Ridge Dr E
- 1519 Pine Ridge Dr E
- 1515 Pine Ridge Dr E
- 1521 Pine Ridge Dr E
- 1513 Pine Ridge Dr E
- 1504E Pine Ridge Dr E
- 1525E Pine Ridge Dr E
- 4220 Cedar Ridge Dr N
- 1521E Pine Ridge Dr E
- 1516 Pine Ridge Dr E
- 4222 Cedar Ridge Dr N
- 1729 Pitchwood Way
- 1523E Pine Ridge Dr E
- 1515E Pine Ridge Dr E
Your Personal Tour Guide
Ask me questions while you tour the home.