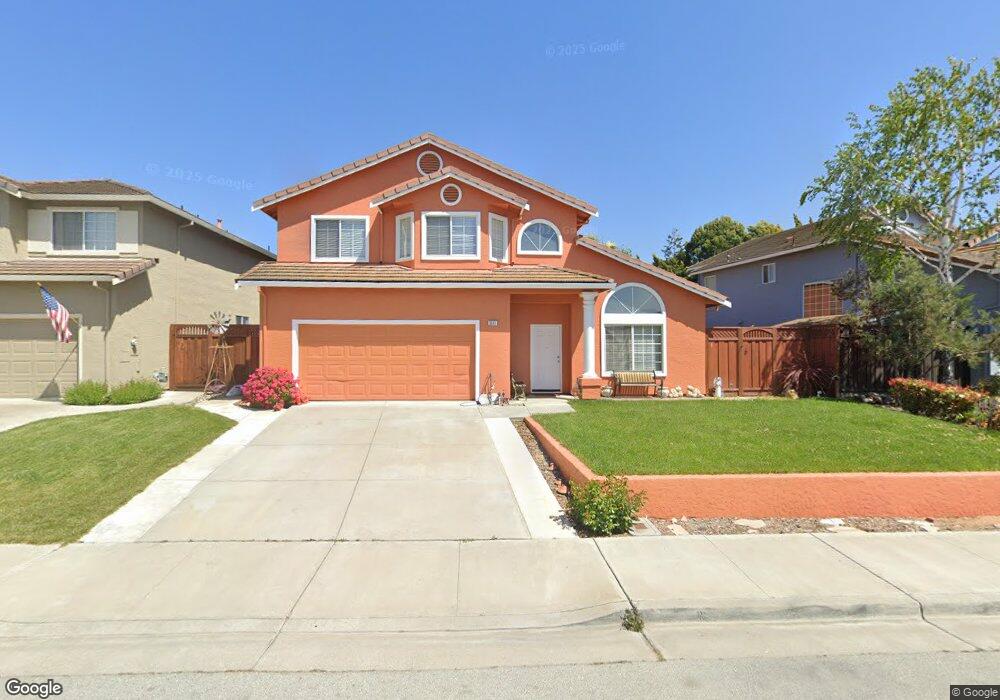
1511 Bayberry St Hollister, CA 95023
Estimated Value: $585,000 - $804,000
--
Bed
--
Bath
--
Sq Ft
6,011
Sq Ft Lot
About This Home
This home is located at 1511 Bayberry St, Hollister, CA 95023 and is currently estimated at $715,570. 1511 Bayberry St is a home located in San Benito County with nearby schools including Cerra Vista Elementary School, Rancho San Justo School, and San Benito High School.
Ownership History
Date
Name
Owned For
Owner Type
Purchase Details
Closed on
Jul 23, 2021
Sold by
Hernandez Claudio G Beyer and Beyer Dorotea
Bought by
Hernandez Claudio G Beyer and Beyer Dorotea
Current Estimated Value
Home Financials for this Owner
Home Financials are based on the most recent Mortgage that was taken out on this home.
Original Mortgage
$263,500
Interest Rate
2.2%
Mortgage Type
New Conventional
Purchase Details
Closed on
Jun 2, 2004
Sold by
Beyer Gustavo
Bought by
Beyer Gustavo and Beyer Dorotea
Home Financials for this Owner
Home Financials are based on the most recent Mortgage that was taken out on this home.
Original Mortgage
$410,000
Interest Rate
5.35%
Mortgage Type
Purchase Money Mortgage
Purchase Details
Closed on
Aug 29, 2002
Sold by
Beyer Gustavo and Beyer Dorotea
Bought by
Beyer Gustavo
Home Financials for this Owner
Home Financials are based on the most recent Mortgage that was taken out on this home.
Original Mortgage
$352,000
Interest Rate
6.29%
Create a Home Valuation Report for This Property
The Home Valuation Report is an in-depth analysis detailing your home's value as well as a comparison with similar homes in the area
Home Values in the Area
Average Home Value in this Area
Purchase History
| Date | Buyer | Sale Price | Title Company |
|---|---|---|---|
| Hernandez Claudio G Beyer | -- | First American Title Ins Co | |
| Beyer Gustavo | -- | Financial Title Company | |
| Beyer Gustavo | -- | Fidelity National Title Co |
Source: Public Records
Mortgage History
| Date | Status | Borrower | Loan Amount |
|---|---|---|---|
| Closed | Hernandez Claudio G Beyer | $263,500 | |
| Closed | Beyer Gustavo | $410,000 | |
| Closed | Beyer Gustavo | $352,000 |
Source: Public Records
Tax History Compared to Growth
Tax History
| Year | Tax Paid | Tax Assessment Tax Assessment Total Assessment is a certain percentage of the fair market value that is determined by local assessors to be the total taxable value of land and additions on the property. | Land | Improvement |
|---|---|---|---|---|
| 2025 | $5,182 | $435,639 | $141,085 | $294,554 |
| 2023 | $5,182 | $418,724 | $135,607 | $283,117 |
| 2022 | $4,999 | $410,515 | $132,949 | $277,566 |
| 2021 | $4,930 | $402,467 | $130,343 | $272,124 |
| 2020 | $4,951 | $398,341 | $129,007 | $269,334 |
| 2019 | $4,807 | $390,531 | $126,478 | $264,053 |
| 2018 | $4,708 | $382,875 | $123,999 | $258,876 |
| 2017 | $4,894 | $375,368 | $121,568 | $253,800 |
| 2016 | $4,620 | $368,009 | $119,185 | $248,824 |
| 2015 | $4,578 | $362,482 | $117,395 | $245,087 |
| 2014 | $4,320 | $355,383 | $115,096 | $240,287 |
Source: Public Records
Map
Nearby Homes
- 2711 Valley View Rd
- 1531 Brighton Dr
- 1600 Panorama Dr
- 2260 Ventana Ct
- 1751 Brighton Dr
- 1740 Brentwood Ct
- 2421 Valley View Rd
- 2180 Clearview Dr
- 1770 Brentwood Ct
- 861 Enterprise Rd
- 2102 White Oak Dr
- 2360 Valley View Rd
- 1900 Lotus Ct
- 2240 Preston Ct
- 1871 Peony St
- 1261 Crestview Dr
- 1880 Peony St
- 1911 Peony St
- 1890 Peony St
- 1900 Peony St
- 1521 Bayberry St
- 1501 Bayberry St
- 2720 Valley View Rd
- 1551 Bayberry St
- 2730 Valley View Rd Unit II
- 1510 Bayberry St
- 1561 Bayberry St
- 1520 Bayberry St
- 1500 Bayberry St
- 2740 Valley View Rd
- 2701 Valley View Rd
- 2430 Yarrow St
- 1530 Bayberry St
- 2691 Valley View Rd
- 2440 Yarrow St
- 2420 Yarrow St
- 2721 Valley View Rd
- 1550 Bayberry St
- 2681 Valley View Rd
- 2450 Yarrow St