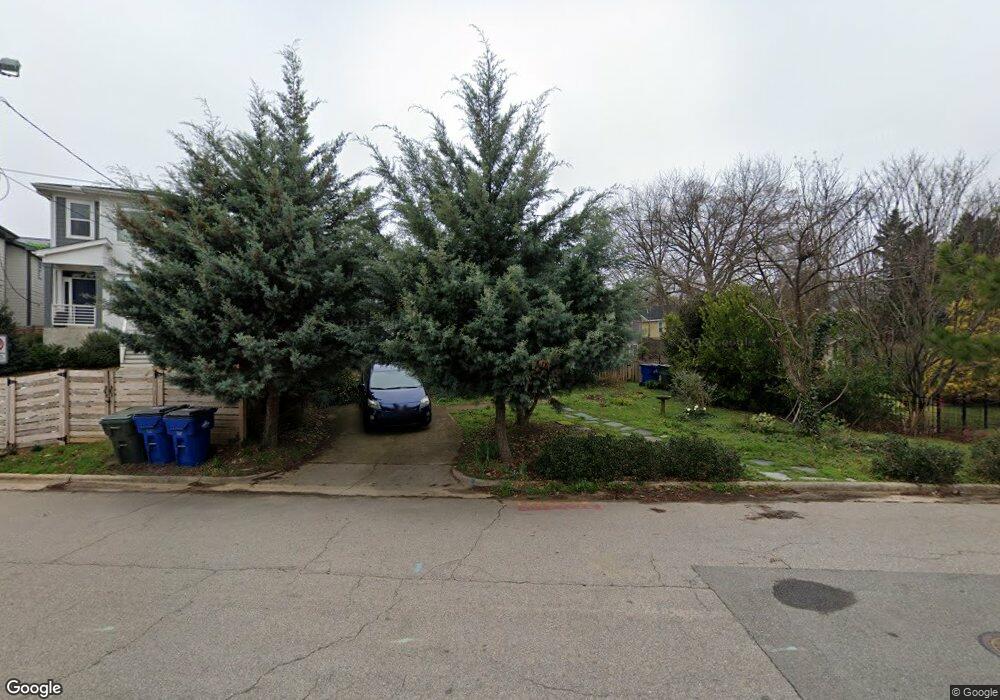
1511 Carson St Raleigh, NC 27608
Five Points NeighborhoodEstimated Value: $478,000 - $596,000
2
Beds
1
Bath
836
Sq Ft
$608/Sq Ft
Est. Value
About This Home
This home is located at 1511 Carson St, Raleigh, NC 27608 and is currently estimated at $508,123, approximately $607 per square foot. 1511 Carson St is a home located in Wake County with nearby schools including Underwood Magnet Elementary School, Oberlin Middle School, and Broughton Magnet High School.
Ownership History
Date
Name
Owned For
Owner Type
Purchase Details
Closed on
Oct 20, 2010
Sold by
Futrell Richard G and Futrell Elizabeth
Bought by
Ashcraft Carol L
Current Estimated Value
Home Financials for this Owner
Home Financials are based on the most recent Mortgage that was taken out on this home.
Original Mortgage
$82,500
Outstanding Balance
$603
Interest Rate
3.88%
Mortgage Type
New Conventional
Estimated Equity
$507,520
Purchase Details
Closed on
Mar 1, 2004
Sold by
Beddingfield Rudy Ty
Bought by
Futrell Richard G
Purchase Details
Closed on
Aug 1, 2002
Sold by
Futrell Richard G
Bought by
Futrell Richard G and Beddingfield Rudy Ty
Home Financials for this Owner
Home Financials are based on the most recent Mortgage that was taken out on this home.
Original Mortgage
$124,000
Interest Rate
5.5%
Purchase Details
Closed on
May 28, 1999
Sold by
Gregory Mark and Gregory Jenny S
Bought by
Futrell Richard G
Home Financials for this Owner
Home Financials are based on the most recent Mortgage that was taken out on this home.
Original Mortgage
$122,000
Interest Rate
6.84%
Create a Home Valuation Report for This Property
The Home Valuation Report is an in-depth analysis detailing your home's value as well as a comparison with similar homes in the area
Home Values in the Area
Average Home Value in this Area
Purchase History
We collect this data history from publicly available records. To have your information removed, we recommend requesting removal directly through your county’s website.
| Date | Buyer | Sale Price | Title Company |
|---|---|---|---|
| Ashcraft Carol L | $202,500 | None Available | |
| Futrell Richard G | -- | -- | |
| Futrell Richard G | -- | -- | |
| Futrell Richard G | $122,500 | -- |
Source: Public Records
Mortgage History
We collect this data history from publicly available records. To have your information removed, we recommend requesting removal directly through your county’s website.
| Date | Status | Borrower | Loan Amount |
|---|---|---|---|
| Open | Ashcraft Carol L | $82,500 | |
| Previous Owner | Futrell Richard G | $124,000 | |
| Previous Owner | Futrell Richard G | $122,000 |
Source: Public Records
Tax History
| Year | Tax Paid | Tax Assessment Tax Assessment Total Assessment is a certain percentage of the fair market value that is determined by local assessors to be the total taxable value of land and additions on the property. | Land | Improvement |
|---|---|---|---|---|
| 2025 | $4,162 | $474,977 | $450,500 | $24,477 |
| 2024 | $4,145 | $474,977 | $450,500 | $24,477 |
| 2023 | $3,595 | $328,015 | $240,000 | $88,015 |
| 2022 | $3,341 | $328,015 | $240,000 | $88,015 |
| 2021 | $3,212 | $328,015 | $240,000 | $88,015 |
| 2020 | $3,153 | $328,015 | $240,000 | $88,015 |
| 2019 | $2,383 | $203,934 | $165,000 | $38,934 |
| 2018 | $2,248 | $203,934 | $165,000 | $38,934 |
| 2017 | $2,142 | $203,934 | $165,000 | $38,934 |
| 2016 | $2,098 | $203,934 | $165,000 | $38,934 |
| 2015 | $1,784 | $170,349 | $79,200 | $91,149 |
| 2014 | $1,692 | $170,349 | $79,200 | $91,149 |
Source: Public Records
Map
Nearby Homes
- 1610 Draper View Loop Unit 101
- 1610 Draper View Loop Unit 102
- 1527 Havenmont Ct
- 1521 Havenmont Ct
- 1525 Havenmont Ct
- 1521 Sunrise Ave
- 1521 1/2 Sunrise Ave
- 1523 Havenmont Ct
- 1523 Sunrise Ave
- 1523 Urban Trace Ln
- 1525 Urban Trace Ln
- 1527 Urban Trace Ln
- 1531 Sunrise Ave
- 1620 Bickett Blvd
- 216 Georgetown Rd
- 204 Georgetown Rd
- 1614 Carson St
- 225 Georgetown Rd
- 1506 Hanover St
- 518 E Whitaker Mill Rd
- 1611 Draper View Loop Unit 106
- 1610 Draper View Loop Unit 106
- 400 Bryan Pointe Dr Unit 102
- 400 Bryan Pointe Dr Unit 100
- 400 Bryan Pointe Dr
- 401 Bryan Pointe Dr Unit 103
- 401 Bryan Pointe Dr Unit 102
- 400 Bryan Pointe Dr Unit 103
- 400 Bryan Pointe Dr Unit 101
- 401 Bryan Pointe Dr Unit 104
- 401 Bryan Pointe Dr Unit 101
- 1611 Draper View Loop
- 1610 Draper View Loop
- 1611 Draper View Loop
- 1611 Draper View Loop
- 1610 Draper View Loop
- 1610 Draper View Loop
- 1611 Draper View Loop Unit 101
- 1501 Draper View Loop Unit 105
- 1501 Draper View Loop Unit 104
Your Personal Tour Guide
Ask me questions while you tour the home.