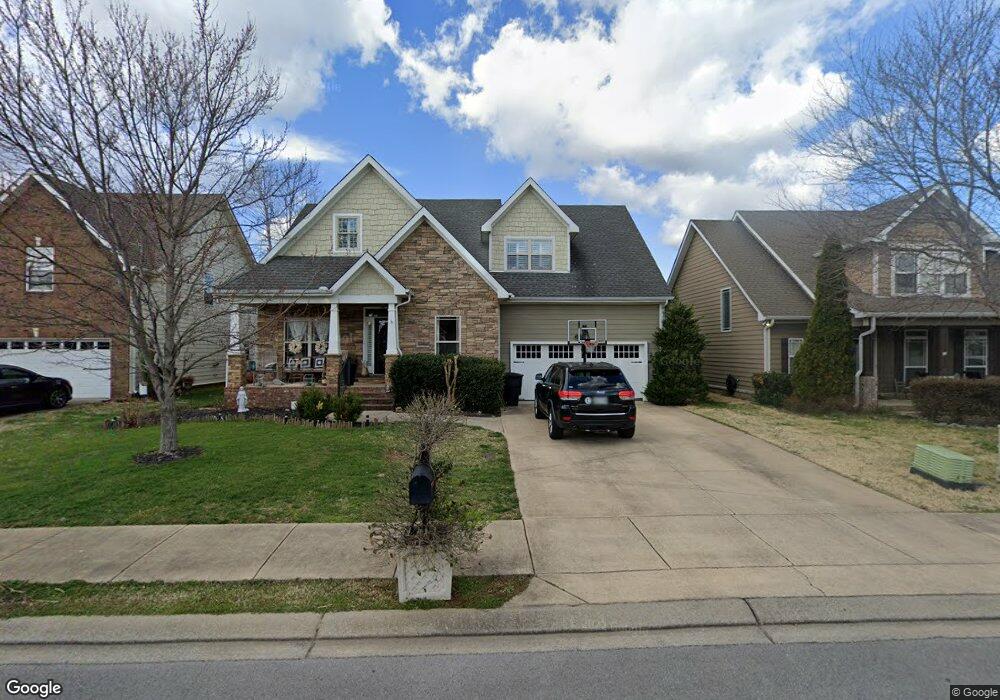
1511 Dewsbury Dr Murfreesboro, TN 37128
Estimated Value: $437,000 - $532,000
--
Bed
--
Bath
2,268
Sq Ft
$217/Sq Ft
Est. Value
About This Home
This home is located at 1511 Dewsbury Dr, Murfreesboro, TN 37128 and is currently estimated at $491,431, approximately $216 per square foot. 1511 Dewsbury Dr is a home located in Rutherford County with nearby schools including Blackman Elementary School, Overall Creek Elementary School, and Blackman Middle School.
Ownership History
Date
Name
Owned For
Owner Type
Purchase Details
Closed on
Dec 18, 2013
Sold by
Morrow Herbert L
Bought by
Strain Benjamin B San San
Current Estimated Value
Home Financials for this Owner
Home Financials are based on the most recent Mortgage that was taken out on this home.
Original Mortgage
$263,145
Outstanding Balance
$195,982
Interest Rate
4.12%
Mortgage Type
FHA
Estimated Equity
$295,449
Purchase Details
Closed on
Nov 5, 2007
Sold by
Mid Cumberland Builders Ll
Bought by
Morrow Herbert L
Home Financials for this Owner
Home Financials are based on the most recent Mortgage that was taken out on this home.
Original Mortgage
$226,955
Interest Rate
6.26%
Purchase Details
Closed on
Feb 26, 2007
Sold by
Mainstreet Homes Llc
Bought by
Mid Cumberland Builders Llc
Purchase Details
Closed on
Dec 19, 2006
Sold by
Mainstreet Homes Llc
Bought by
Clark J O Construction Co Llc
Create a Home Valuation Report for This Property
The Home Valuation Report is an in-depth analysis detailing your home's value as well as a comparison with similar homes in the area
Home Values in the Area
Average Home Value in this Area
Purchase History
| Date | Buyer | Sale Price | Title Company |
|---|---|---|---|
| Strain Benjamin B San San | $268,000 | -- | |
| Strain Benjamin B San San | $268,000 | -- | |
| Morrow Herbert L | $238,900 | -- | |
| Mid Cumberland Builders Llc | $41,900 | -- | |
| Clark J O Construction Co Llc | $83,800 | -- |
Source: Public Records
Mortgage History
| Date | Status | Borrower | Loan Amount |
|---|---|---|---|
| Open | Strain Benjamin B San San | $263,145 | |
| Closed | Clark J O Construction Co Llc | $263,145 | |
| Previous Owner | Clark J O Construction Co Llc | $226,955 |
Source: Public Records
Tax History Compared to Growth
Tax History
| Year | Tax Paid | Tax Assessment Tax Assessment Total Assessment is a certain percentage of the fair market value that is determined by local assessors to be the total taxable value of land and additions on the property. | Land | Improvement |
|---|---|---|---|---|
| 2025 | $2,966 | $104,850 | $13,750 | $91,100 |
| 2024 | $2,966 | $104,850 | $13,750 | $91,100 |
| 2023 | $1,967 | $104,850 | $13,750 | $91,100 |
| 2022 | $1,695 | $104,850 | $13,750 | $91,100 |
| 2021 | $1,616 | $72,825 | $11,875 | $60,950 |
| 2020 | $1,616 | $72,825 | $11,875 | $60,950 |
| 2019 | $1,616 | $72,825 | $11,875 | $60,950 |
Source: Public Records
Map
Nearby Homes
- 1526 Dewsbury Dr
- 5408 Middlebury Dr
- 2108 Olmstead Ct
- 1217 Westlawn Blvd
- 0 Vaughn Rd
- 5227 Starnes Dr
- 6410 Hickory Bell Dr
- 4814 Saint Ives Dr
- 4439 Chusto Dr
- 0 Burnt Knob Rd
- 4332 Pender Ct
- 1232 Stockwell Dr
- 1716 John Lee Ln
- 1235 Timber Creek Dr
- 5350 Tony Lama Ln
- 5309 Perlou Ln
- 1614 Lannister Ave
- 1704 Lannister Ave
- 4304 Faran David Ct
- 1772 Frodo Way
- 1515 Dewsbury Dr
- 1507 Dewsbury Dr
- 1512 Barnsley Dr
- 1519 Dewsbury Dr
- 1503 Dewsbury Dr
- 1516 Barnsley Dr
- 1508 Barnsley Dr
- 1520 Barnsley Dr
- 1504 Barnsley Dr
- 1510 Dewsbury Dr
- 1514 Dewsbury Dr
- 1506 Dewsbury Dr
- 1524 Barnsley Dr
- 1523 Dewsbury Dr
- 1502 Dewsbury Dr
- 1522 Dewsbury Dr
- 1423 Billingham Dr
- 64 Barnsley Dr
- 62 Barnsley Dr
- 1528 Barnsley Dr