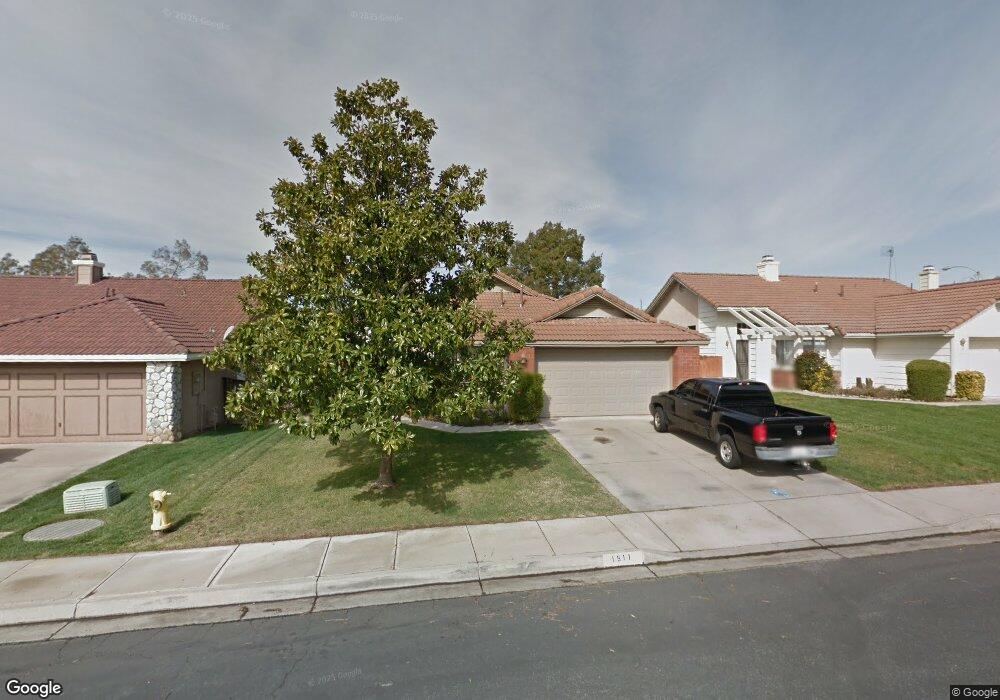
1511 Sequoia Dr Beaumont, CA 92223
Estimated Value: $381,000 - $470,000
3
Beds
2
Baths
1,293
Sq Ft
$325/Sq Ft
Est. Value
About This Home
This home is located at 1511 Sequoia Dr, Beaumont, CA 92223 and is currently estimated at $420,513, approximately $325 per square foot. 1511 Sequoia Dr is a home located in Riverside County with nearby schools including Anna Hause Elementary School, San Gorgonio Middle School, and Beaumont Senior High School.
Ownership History
Date
Name
Owned For
Owner Type
Purchase Details
Closed on
May 5, 2009
Sold by
Schnur Boldizar Elisha and Schnur Elisha
Bought by
Ochoa Rene and Ochoa Lori K
Current Estimated Value
Home Financials for this Owner
Home Financials are based on the most recent Mortgage that was taken out on this home.
Original Mortgage
$148,265
Outstanding Balance
$93,425
Interest Rate
4.8%
Mortgage Type
FHA
Estimated Equity
$327,088
Purchase Details
Closed on
Feb 28, 2007
Sold by
Clark Jerry D
Bought by
Schnur Elisha
Home Financials for this Owner
Home Financials are based on the most recent Mortgage that was taken out on this home.
Original Mortgage
$316,000
Interest Rate
8.75%
Mortgage Type
Balloon
Purchase Details
Closed on
Aug 11, 1993
Sold by
Fn Development Company
Bought by
Clark Jerry D
Home Financials for this Owner
Home Financials are based on the most recent Mortgage that was taken out on this home.
Original Mortgage
$102,662
Interest Rate
6.74%
Mortgage Type
Assumption
Create a Home Valuation Report for This Property
The Home Valuation Report is an in-depth analysis detailing your home's value as well as a comparison with similar homes in the area
Home Values in the Area
Average Home Value in this Area
Purchase History
| Date | Buyer | Sale Price | Title Company |
|---|---|---|---|
| Ochoa Rene | $151,000 | Ticor Title Company | |
| Schnur Boldizar Elisha | -- | Ticor Title Company | |
| Schnur Elisha | $316,000 | Community Title | |
| Clark Jerry D | -- | Community Title | |
| Clark Jerry D | $103,000 | Orange Coast Title |
Source: Public Records
Mortgage History
| Date | Status | Borrower | Loan Amount |
|---|---|---|---|
| Open | Ochoa Rene | $148,265 | |
| Previous Owner | Schnur Elisha | $316,000 | |
| Previous Owner | Clark Jerry D | $102,662 |
Source: Public Records
Tax History
| Year | Tax Paid | Tax Assessment Tax Assessment Total Assessment is a certain percentage of the fair market value that is determined by local assessors to be the total taxable value of land and additions on the property. | Land | Improvement |
|---|---|---|---|---|
| 2025 | $2,315 | $64,553 | $57,938 | $6,615 |
| 2023 | $2,315 | $62,048 | $55,689 | $6,359 |
| 2022 | $3,800 | $183,219 | $54,596 | $128,623 |
| 2021 | $3,502 | $179,627 | $53,526 | $126,101 |
| 2020 | $3,296 | $177,786 | $52,978 | $124,808 |
| 2019 | $3,558 | $174,301 | $51,940 | $122,361 |
| 2018 | $3,464 | $170,884 | $50,923 | $119,961 |
| 2017 | $3,396 | $167,534 | $49,925 | $117,609 |
| 2016 | $3,302 | $164,250 | $48,947 | $115,303 |
| 2015 | $3,234 | $161,785 | $48,213 | $113,572 |
| 2014 | $3,196 | $158,618 | $47,269 | $111,349 |
Source: Public Records
Map
Nearby Homes
- 643 Canyon Crest Rd
- 1521 Susan St
- 577 Cedar View Dr
- 1520 Trinette Dr
- 1627 Jon Gilbert Ln
- 1650 Ravenswood Rd
- 1444 Michigan Ave Unit 50
- 1444 Michigan Ave Unit 1
- 1444 Michigan Ave Unit 40
- 1385 Palm Ave
- 1279 Cedar Hollow Rd
- 757 Cherry Valley
- 11345 Sunnyslope Ave
- 1587 Milky Way
- 11285 Cherry Ave
- 1322 Bannock St
- 1327 Black Diamond
- 1555 Peridot Ln
- 1355 Mary Ln
- 1335 Alpine Ave
- 1513 Sequoia Dr
- 1509 Sequoia Dr
- 0 Spruce Place Unit 28049IC
- 1515 Sequoia Dr
- 1507 Sequoia Dr
- 706 Spruce Place
- 1517 Sequoia Dr
- 1505 Sequoia Dr
- 707 Spruce Place
- 708 Spruce Place
- 1518 Pacific Trails Way
- 693 Canyon Crest Rd
- 705 Canyon Crest Rd
- 1522 Pacific Trails Way
- 1503 Sequoia Dr
- 1512 Pacific Trails Way
- 709 Spruce Place
- 685 Canyon Crest Rd
- 707 Canyon Crest Rd
- 1510 Pacific Trails Way
Your Personal Tour Guide
Ask me questions while you tour the home.