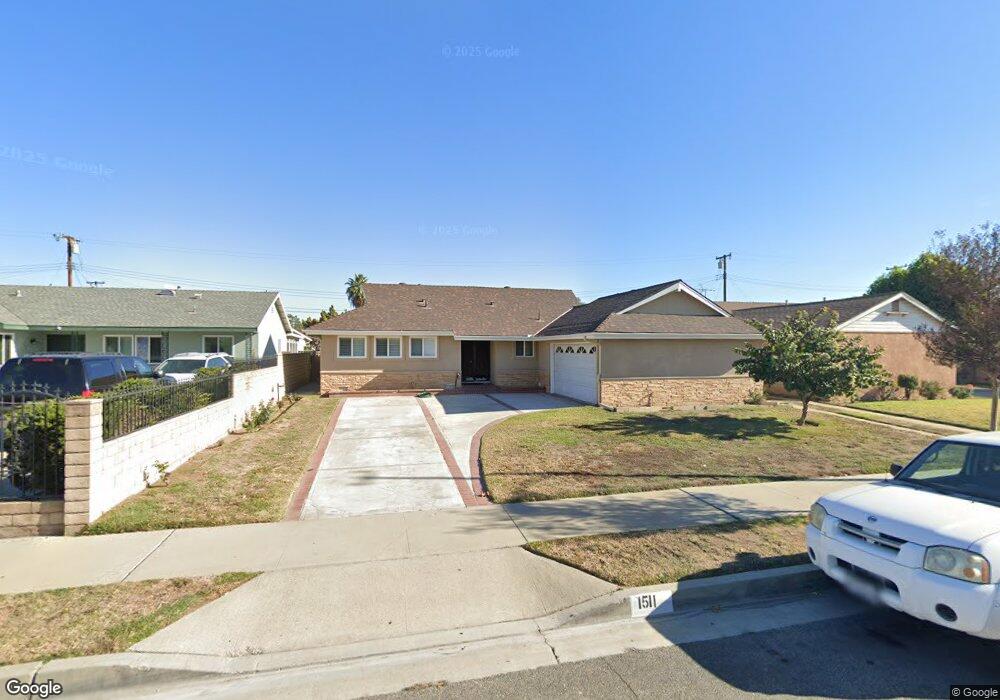
1511 W Fairgrove Ave West Covina, CA 91790
Estimated Value: $805,400 - $876,000
3
Beds
2
Baths
1,316
Sq Ft
$640/Sq Ft
Est. Value
About This Home
This home is located at 1511 W Fairgrove Ave, West Covina, CA 91790 and is currently estimated at $842,600, approximately $640 per square foot. 1511 W Fairgrove Ave is a home located in Los Angeles County with nearby schools including California Elementary School, Edgewood Middle School, and Edgewood High School.
Ownership History
Date
Name
Owned For
Owner Type
Purchase Details
Closed on
Jan 27, 2016
Sold by
Perez Heriberto
Bought by
Perez Heriberto and Sandoval Selina
Current Estimated Value
Home Financials for this Owner
Home Financials are based on the most recent Mortgage that was taken out on this home.
Original Mortgage
$312,000
Outstanding Balance
$248,640
Interest Rate
3.94%
Mortgage Type
New Conventional
Estimated Equity
$593,960
Purchase Details
Closed on
Sep 13, 1999
Sold by
Fry Rodney M
Bought by
Perez Heriberto
Home Financials for this Owner
Home Financials are based on the most recent Mortgage that was taken out on this home.
Original Mortgage
$181,503
Interest Rate
7.96%
Mortgage Type
FHA
Purchase Details
Closed on
Sep 29, 1998
Sold by
Fry Rodney M
Bought by
Fry Rodney M and Fry Nancy C
Purchase Details
Closed on
May 7, 1998
Sold by
Fry Rodney M
Bought by
Fry Rodney M and Fry Nancy C
Create a Home Valuation Report for This Property
The Home Valuation Report is an in-depth analysis detailing your home's value as well as a comparison with similar homes in the area
Home Values in the Area
Average Home Value in this Area
Purchase History
| Date | Buyer | Sale Price | Title Company |
|---|---|---|---|
| Perez Heriberto | -- | Provident Title | |
| Perez Heriberto | $183,000 | First American Title Co | |
| Fry Rodney M | -- | -- | |
| Fry Rodney M | -- | -- |
Source: Public Records
Mortgage History
| Date | Status | Borrower | Loan Amount |
|---|---|---|---|
| Open | Perez Heriberto | $312,000 | |
| Previous Owner | Perez Heriberto | $181,503 |
Source: Public Records
Tax History Compared to Growth
Tax History
| Year | Tax Paid | Tax Assessment Tax Assessment Total Assessment is a certain percentage of the fair market value that is determined by local assessors to be the total taxable value of land and additions on the property. | Land | Improvement |
|---|---|---|---|---|
| 2025 | $3,684 | $281,240 | $133,243 | $147,997 |
| 2024 | $3,684 | $275,727 | $130,631 | $145,096 |
| 2023 | $3,507 | $270,321 | $128,070 | $142,251 |
| 2022 | $3,529 | $265,021 | $125,559 | $139,462 |
| 2021 | $3,429 | $259,826 | $123,098 | $136,728 |
| 2019 | $3,336 | $252,122 | $119,448 | $132,674 |
| 2018 | $3,128 | $247,179 | $117,106 | $130,073 |
| 2016 | $2,854 | $237,582 | $112,559 | $125,023 |
| 2015 | $2,798 | $234,015 | $110,869 | $123,146 |
| 2014 | $2,783 | $229,432 | $108,698 | $120,734 |
Source: Public Records
Map
Nearby Homes
- 1828 Stargaze Dr
- 1528 W Delvale St
- 14421 Flynn St
- 1544 Evanwood Ave
- 1911 W Doublegrove St
- 822 Greenberry Dr
- 829 Foxworth Ave
- 979 Willow Ave Unit 31
- 943 Willow Ave
- 717 Sandsprings Dr
- 1525 Bromley Ave
- 1816 W Yarnell St
- 1329 N Stimson Ave
- 1529 Cascade
- 1326 Mayland Ave
- 14972 Giordano St
- 544 N Orange Ave Unit B
- 13926 Janetdale St
- 14617 Beckner St
- 14266 Beckner St
- 1507 W Fairgrove Ave
- 1515 W Fairgrove Ave
- 1512 Joycedale Ave
- 1519 W Fairgrove Ave
- 1951 S Cabana Ave
- 1516 Joycedale Ave
- 1508 Joycedale Ave
- 1937 S Cabana Ave
- 14560 Fairgrove Ave
- 14602 Fairgrove Ave
- 14556 Fairgrove Ave
- 1520 Joycedale Ave
- 14608 Fairgrove Ave
- 1950 S Tonopah Ave
- 14550 Fairgrove Ave
- 1944 S Tonopah Ave
- 14544 Fairgrove Ave
- 1950 S Cabana Ave
- 1938 S Tonopah Ave
- 14531 Rath St