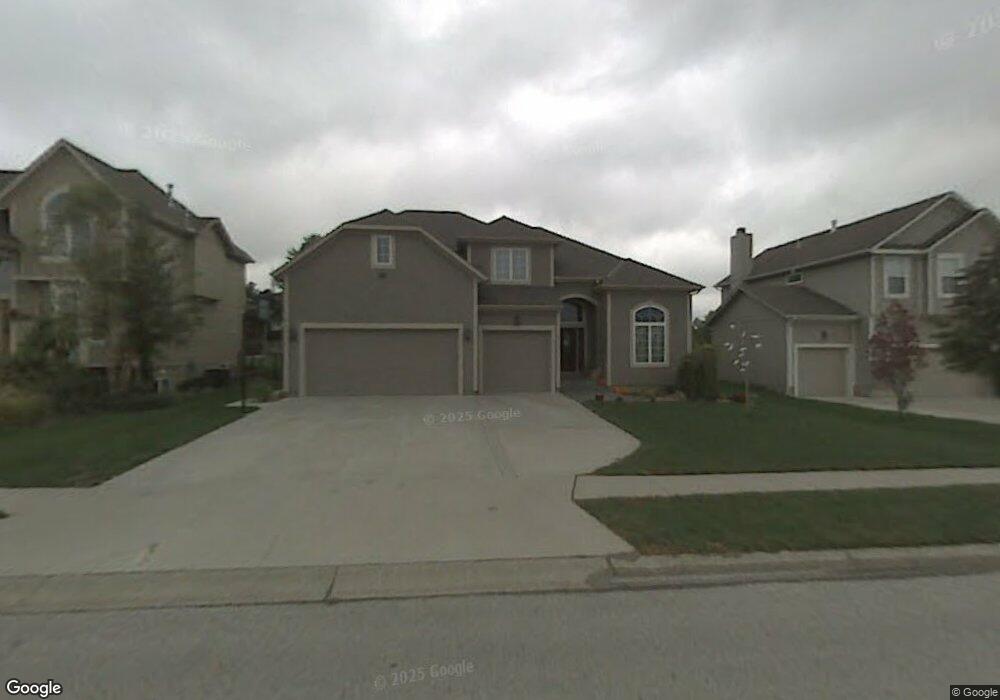
15112 W 93rd St Lenexa, KS 66219
Estimated Value: $533,000 - $695,000
4
Beds
4
Baths
3,141
Sq Ft
$189/Sq Ft
Est. Value
About This Home
This home is located at 15112 W 93rd St, Lenexa, KS 66219 and is currently estimated at $593,380, approximately $188 per square foot. 15112 W 93rd St is a home located in Johnson County with nearby schools including Sunflower Elementary School, Westridge Middle School, and Shawnee Mission West High School.
Ownership History
Date
Name
Owned For
Owner Type
Purchase Details
Closed on
Oct 7, 2021
Sold by
Orme Robert E and Orme Kristie
Bought by
Orme Robert E and Orme Kristie
Current Estimated Value
Purchase Details
Closed on
May 17, 2007
Sold by
Brady Thomas M and Brady Angela L
Bought by
Orme Robert E and Orme Kristie
Home Financials for this Owner
Home Financials are based on the most recent Mortgage that was taken out on this home.
Original Mortgage
$282,000
Outstanding Balance
$170,692
Interest Rate
6.17%
Mortgage Type
New Conventional
Estimated Equity
$422,688
Purchase Details
Closed on
Jul 11, 2002
Sold by
Ehlen Charles P and Ehlen Nancy
Bought by
Brady Thomas M and Brady Angela L
Home Financials for this Owner
Home Financials are based on the most recent Mortgage that was taken out on this home.
Original Mortgage
$160,000
Interest Rate
6.69%
Create a Home Valuation Report for This Property
The Home Valuation Report is an in-depth analysis detailing your home's value as well as a comparison with similar homes in the area
Home Values in the Area
Average Home Value in this Area
Purchase History
| Date | Buyer | Sale Price | Title Company |
|---|---|---|---|
| Orme Robert E | -- | None Available | |
| Orme Robert E | -- | First American Title Insuran | |
| Brady Thomas M | -- | Columbian National Title Ins |
Source: Public Records
Mortgage History
| Date | Status | Borrower | Loan Amount |
|---|---|---|---|
| Open | Orme Robert E | $282,000 | |
| Previous Owner | Brady Thomas M | $160,000 |
Source: Public Records
Tax History Compared to Growth
Tax History
| Year | Tax Paid | Tax Assessment Tax Assessment Total Assessment is a certain percentage of the fair market value that is determined by local assessors to be the total taxable value of land and additions on the property. | Land | Improvement |
|---|---|---|---|---|
| 2024 | $7,244 | $65,217 | $10,594 | $54,623 |
| 2023 | $7,130 | $63,388 | $10,095 | $53,293 |
| 2022 | $6,556 | $59,202 | $9,609 | $49,593 |
| 2021 | $5,956 | $50,393 | $9,154 | $41,239 |
| 2020 | $5,632 | $47,162 | $8,317 | $38,845 |
| 2019 | $5,433 | $45,471 | $7,237 | $38,234 |
| 2018 | $5,549 | $46,518 | $6,583 | $39,935 |
| 2017 | $5,081 | $40,848 | $5,986 | $34,862 |
| 2016 | $4,987 | $39,595 | $5,986 | $33,609 |
| 2015 | $4,956 | $39,641 | $5,986 | $33,655 |
| 2013 | -- | $39,066 | $5,986 | $33,080 |
Source: Public Records
Map
Nearby Homes
- 15320 W 92nd Place
- 9124 Constance St
- 9131 Darnell St
- 9318 Greenway Ln
- 9202 Greenway Ln
- 8946 Country Hill Ct
- 9207 Boehm Dr
- 9203 Boehm Dr
- 15920 W 91st Terrace
- 9029 Acuff Ln
- 8919 Greenway Ln
- 14101 W 88th Place
- 8616 Baska Ct
- 15611 W 86th St
- 8641 Greenwood Ln
- 14424 W 84th Terrace
- 14620 W 84th St
- 8403 Swarner Dr
- 15710 W 84th Terrace
- 14915 W 84th Terrace
- 15118 W 93rd St
- 15106 W 93rd St
- 15100 W 93rd St
- 15124 W 93rd St
- 15105 W 92nd Terrace
- 15111 W 92nd Terrace
- 15103 W 92nd Terrace
- 9300 Rosner Dr
- 15117 W 92nd Terrace
- 9301 Swarner Dr
- 9303 Rosner Dr
- 15101 W 92nd Terrace
- 9306 Rosner Dr
- 15020 W 93rd St
- 15200 W 93rd St
- 15017 Brentwood Dr
- 9307 Swarner Dr
- 9244 Swarner Dr
- 9309 Rosner Dr
- 9235 Swarner Dr