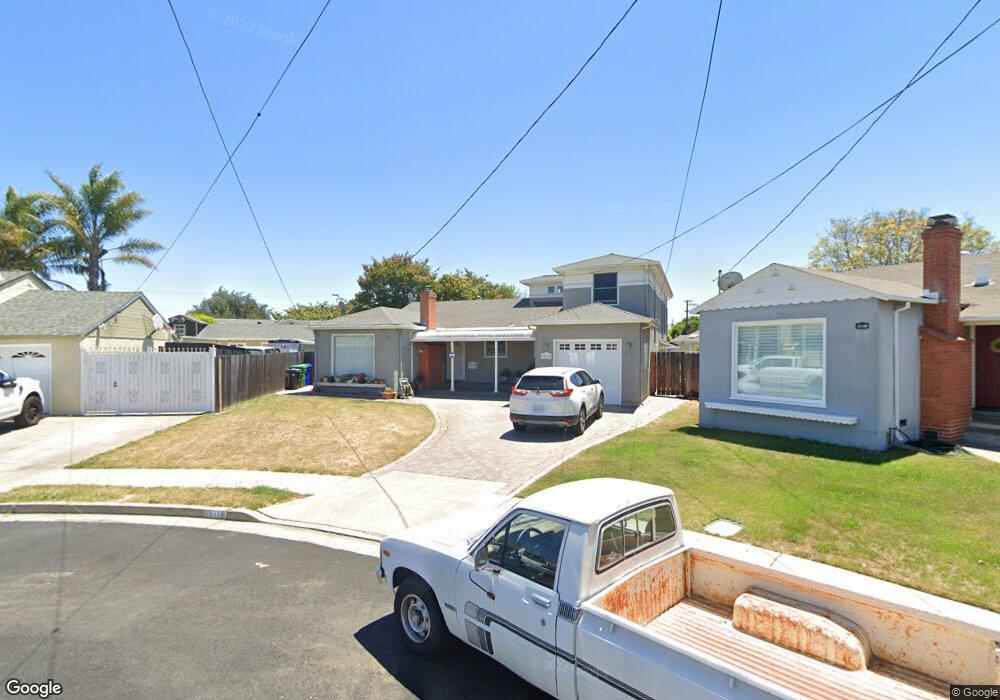
15118 Chapel Ct San Leandro, CA 94579
Washington Manor-Bonaire NeighborhoodEstimated Value: $1,002,000 - $1,083,000
4
Beds
2
Baths
2,098
Sq Ft
$498/Sq Ft
Est. Value
About This Home
This home is located at 15118 Chapel Ct, San Leandro, CA 94579 and is currently estimated at $1,044,828, approximately $498 per square foot. 15118 Chapel Ct is a home located in Alameda County with nearby schools including Dayton Elementary School, Washington Manor Middle School, and Arroyo High School.
Ownership History
Date
Name
Owned For
Owner Type
Purchase Details
Closed on
May 20, 2016
Sold by
Phan Jimmy and Phan Amy
Bought by
He Yi Qiang and Ye Li Min
Current Estimated Value
Home Financials for this Owner
Home Financials are based on the most recent Mortgage that was taken out on this home.
Original Mortgage
$450,000
Outstanding Balance
$366,682
Interest Rate
3.58%
Mortgage Type
New Conventional
Estimated Equity
$678,146
Purchase Details
Closed on
Jul 21, 2015
Sold by
Meares Kevin A and Meares Cheryl L
Bought by
Phan Jimmy and Phan Amy
Home Financials for this Owner
Home Financials are based on the most recent Mortgage that was taken out on this home.
Original Mortgage
$83,200
Interest Rate
3.98%
Mortgage Type
Unknown
Purchase Details
Closed on
Mar 19, 1996
Sold by
Edwards Howard C and Edwards Frances D
Bought by
Meares Kevin A and Meares Cheryl L
Home Financials for this Owner
Home Financials are based on the most recent Mortgage that was taken out on this home.
Original Mortgage
$117,750
Interest Rate
7.41%
Create a Home Valuation Report for This Property
The Home Valuation Report is an in-depth analysis detailing your home's value as well as a comparison with similar homes in the area
Home Values in the Area
Average Home Value in this Area
Purchase History
| Date | Buyer | Sale Price | Title Company |
|---|---|---|---|
| He Yi Qiang | $700,000 | Chicago Title Company | |
| Phan Jimmy | $520,000 | None Available | |
| Meares Kevin A | $157,000 | Fidelity National Title Ins |
Source: Public Records
Mortgage History
| Date | Status | Borrower | Loan Amount |
|---|---|---|---|
| Open | He Yi Qiang | $450,000 | |
| Previous Owner | Phan Jimmy | $83,200 | |
| Previous Owner | Meares Kevin A | $117,750 | |
| Closed | Meares Kevin A | $117,750 |
Source: Public Records
Tax History Compared to Growth
Tax History
| Year | Tax Paid | Tax Assessment Tax Assessment Total Assessment is a certain percentage of the fair market value that is determined by local assessors to be the total taxable value of land and additions on the property. | Land | Improvement |
|---|---|---|---|---|
| 2025 | $10,438 | $843,510 | $248,591 | $601,919 |
| 2024 | $10,438 | $826,835 | $243,717 | $590,118 |
| 2023 | $10,374 | $817,490 | $238,940 | $578,550 |
| 2022 | $10,232 | $794,461 | $234,255 | $567,206 |
| 2021 | $9,916 | $778,747 | $229,662 | $556,085 |
| 2020 | $9,712 | $777,693 | $227,308 | $550,385 |
| 2019 | $9,460 | $742,840 | $222,852 | $519,988 |
| 2018 | $8,976 | $728,280 | $218,484 | $509,796 |
| 2017 | $8,556 | $714,000 | $214,200 | $499,800 |
| 2016 | $7,481 | $615,000 | $184,500 | $430,500 |
| 2015 | $3,739 | $295,335 | $65,102 | $230,233 |
| 2014 | $3,682 | $289,551 | $63,827 | $225,724 |
Source: Public Records
Map
Nearby Homes
- 15102 Chapel Ct
- 1311 Hubbard Ave
- 1315 Mersey Ave
- 15001 Norton St Unit 1
- 15382 Andover St
- 117 Santa Teresa
- 112 Santa Teresa
- 688 Garside Ct
- 15356 Sullivan Ave
- 1562 Randy St
- 154 Santa Teresa
- 15535 Sedgeman St
- 1950 Randy St
- 720 Fargo Ave Unit 14
- 874 Lewelling Blvd
- 15049 Kesterson St
- 619 Beatrice St
- 14666 Wiley St
- 440 Santa Monica
- 700 Fargo Ave Unit 2
- 15126 Chapel Ct
- 15110 Chapel Ct
- 15133 Farnsworth St
- 15141 Farnsworth St
- 15125 Farnsworth St
- 1319 Fargo Ave
- 1313 Fargo Ave
- 1325 Fargo Ave
- 15127 Chapel Ct
- 15117 Farnsworth St
- 1307 Fargo Ave
- 1331 Fargo Ave
- 15119 Chapel Ct Unit 724
- 15111 Chapel Ct
- 15109 Farnsworth St
- 1337 Fargo Ave
- 15103 Chapel Ct
- 15140 Farnsworth St
- 15132 Farnsworth St
- 15148 Farnsworth St